There are no items in your cart
Add More
Add More
| Item Details | Price | ||
|---|---|---|---|

📈 CarTrade Tech Ltd – Technical Analysis Report
Date: July 9, 2025
Timeframe: Daily Chart
Disclaimer: This analysis is for educational and informational purposes only. It does not constitute a recommendation to buy or sell securities. Always do your own research or consult a registered financial advisor before making trading decisions.
🔍 Chart Pattern: Symmetrical Triangle Breakout
CarTrade Tech Ltd has displayed a classic symmetrical triangle breakout on the daily chart — a powerful continuation pattern that often indicates the start of a new trend phase.
The triangle was formed over several weeks, with price compressing within converging trendlines, hinting at an impending directional move. The breakout occurred with a strong bullish
candle closing near the day’s high — a sign of clear buying strength.
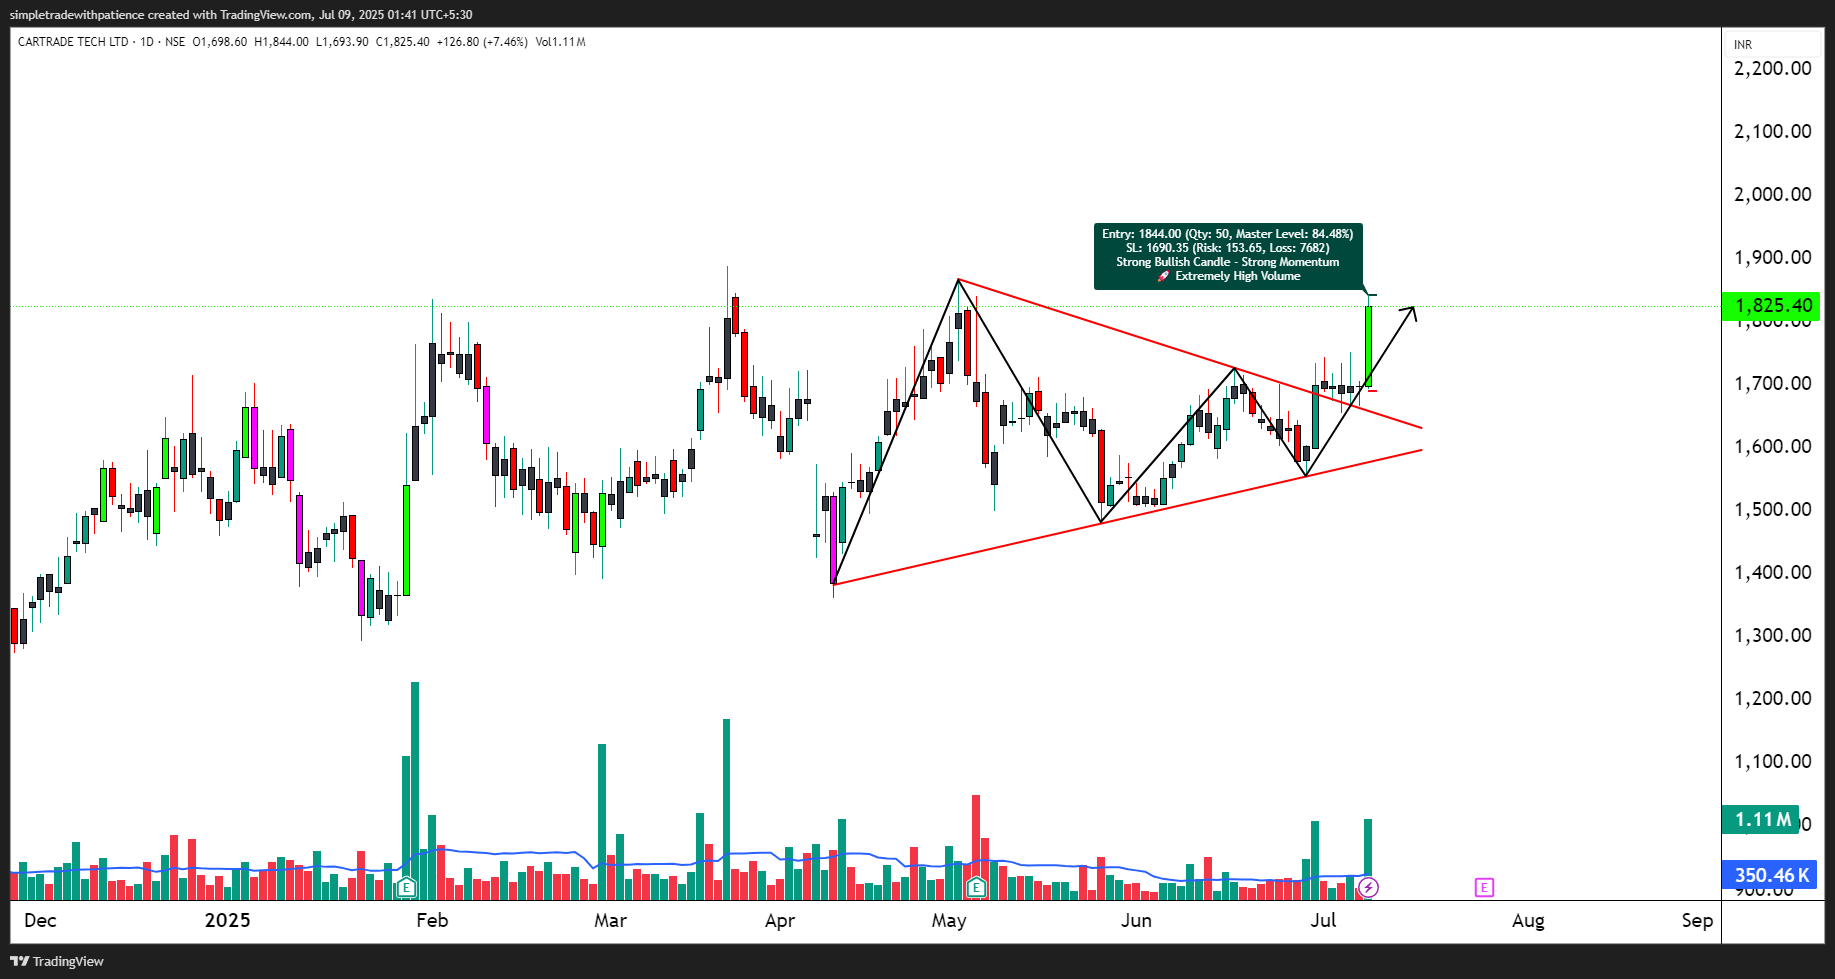
📊 Volume Analysis: Institutional Activity Alert
What adds strength to this breakout is the significant surge in volume:
✅ 5X Average Volume on breakout day
✅ 20-Day Volume Breakout
✅ Extremely High Participation — indicative of institutional entry
Volume is a key confirming factor for any price pattern. In this case, it validates the bullish momentum and increases the probability of trend continuation.
🔬 Indicator Confluence: Momentum + Volatility Expansion
Several technical indicators align with this breakout:
📈 RSI Breakout – Momentum is turning bullish
📈 Bollinger Band Squeeze + Expansion – Signals volatility release
📈 SuperTrend Bullish Signal – Trend confirmation
📈 BB Squeeze On – Compression Breakout – Indicates fresh movement
This combination signals a high-probability breakout setup, suitable for both intraday and swing traders from a study perspective.
🧭 Key Technical Levels:
Resistance Zones:
Resistance 1: ₹1881.63
Resistance 2: ₹1937.87
Resistance 3: ₹2031.73
Top Range Zone: ₹1889 is the immediate hurdle to monitor
Support Levels:
Support 1: ₹1731.53
Support 2: ₹1637.67
Support 3: ₹1581.43
Base Range Support: ₹1362.50 – strong demand zone from previous swing lows
🎯 Trade Setup for Learning: This is a good case study of how volume + price action + indicator alignment can present a strong technical scenario.
Example Calculation (for study purposes only):
This is a hypothetical trade setup used for strategy education only.
📘 Summary:
🧠 Educational Takeaway:
When multiple factors like pattern breakout, volume spike, RSI momentum, and indicator confirmation align, the setup becomes more reliable from a technical standpoint. This example emphasizes the importance of multi-factor confirmation in trade planning.
⚠️ Disclaimer (Please Read):
• This chart is shared for educational purposes only and is not investment advice.
• I am not a SEBI-registered advisor.
• The information provided here is based on personal market observation.
• No buy/sell recommendations are being made.
• Please do your own research or consult a registered financial advisor before making any trading decisions.
• Trading involves risk. Always use proper risk management.
📌 Stay tuned for more technical breakdowns and learning setups!
{{DATE}}
 Launch your Graphy