There are no items in your cart
Add More
Add More
| Item Details | Price | ||
|---|---|---|---|

📘 CEAT Ltd – Trendline Breakout with Volume Surge
📅 Date: July 9, 2025 | ⏱ Timeframe: Daily Chart
🔍 Educational Breakdown – Learning to Trade with Structure
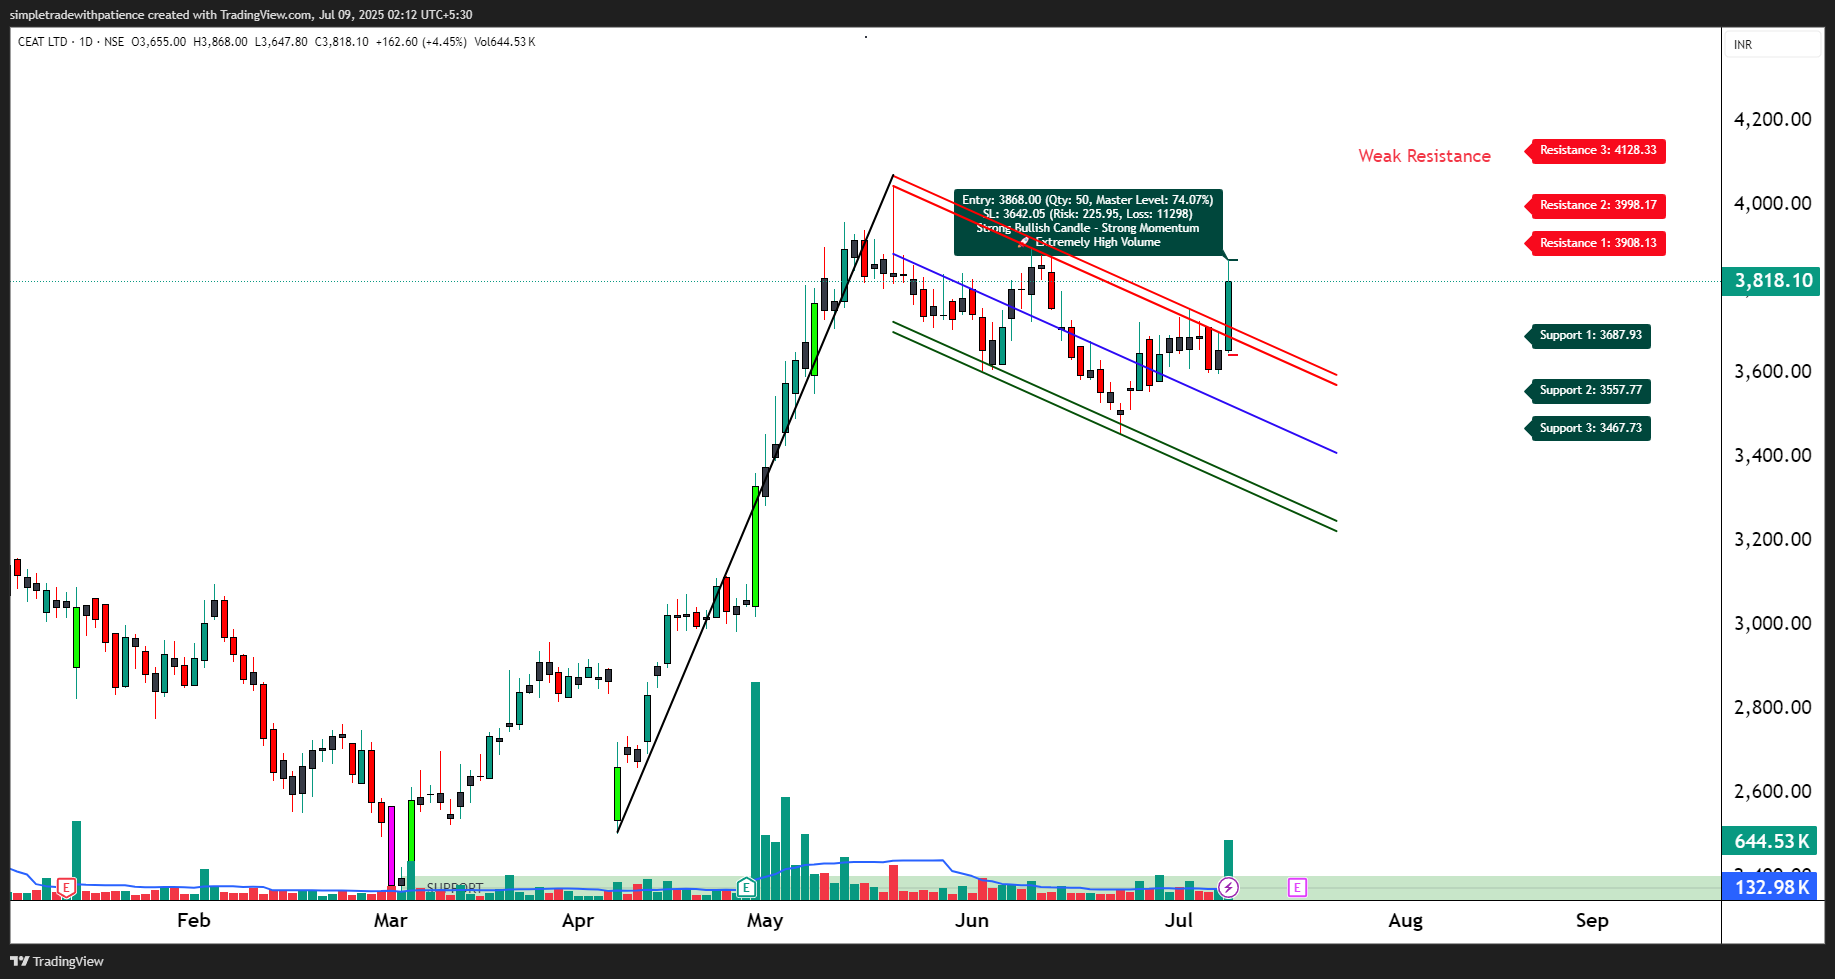
🔍 What’s Happening on the Chart? CEAT Ltd has broken out of a falling channel (downward sloping pattern) after weeks of consolidation. This breakout is supported by strong
bullish momentum and a significant spike in volume. This pattern is a powerful example for learning traders about breakout structures, entry setups, and risk management.
🧱 Price Action Journey: Step-by-Step
📈 1. Strong Uptrend (April–May) CEAT moved sharply upward in a series of green candles supported by high volume — a sign of strong buyer interest.
🔁 2. Correction Phase (June) After the rally, price entered a falling channel — a normal pullback in an otherwise bullish trend. This was marked by lower highs and lower lows.
💥 3. Breakout (July 9) The stock broke out of the upper trendline on a powerful bullish candle with volume 5x above the average, signaling renewed bullish momentum.
📌 Trade Setup for Study Purpose (Not a Recommendation)
For learning purposes, let’s understand how a structured trade setup might look based on CEAT Ltd’s breakout. The example entry is taken at ₹3868.00, which is the high of the breakout candle. A logical stop loss is placed at ₹3642.05 — just below the recent support zone and the lower trendline of the broken channel. This results in a risk of ₹225.95 per share. If a sample quantity of 50 shares is considered, the total potential risk amounts to ₹11,298. The trade is confirmed by a strong bullish candle, supported by a significant surge in volume and a clean breakout from structure. The setup is typically labeled as a "Strong Bullish Candle with High Volume" — a pattern many traders watch for as a sign of momentum and conviction.
📊 Support & Resistance Zones (Visual Markers)
| 🔴 Resistance Levels | 🟢 Support Levels |
| Resistance 1: ₹3908.13 | Support 1: ₹3687.93 |
| Resistance 2: ₹3998.17 | Support 2: ₹3557.77 |
| Resistance 3: ₹4128.33 | Support 3: ₹3467.73 |
🎓 Key Learning Points for New Traders Breakout Strategy: Look for price escaping a structure (like a falling channel). Volume Confirmation: High volume increases trust in the breakout. Risk Management: Every trade setup must define a stop-loss. Don’t Rush: Always mark your support/resistance zones before entering. Practice First: Use tools like paper trading or backtesting before risking capital.
💬 Simple Definitions
| 📘 Term | ✅ What It Means |
| Breakout | When price moves outside a key level with force and volume |
| Support | A level where price may bounce back up due to buying pressure |
| Resistance | A level where price may slow down or fall due to selling pressure |
| Stop Loss | A pre-defined level where you exit to protect against more loss |
| Risk per Share | Difference between Entry and Stop Loss |
⚠️ Disclaimer (Please Read):
• This chart is shared for educational purposes only and is not investment advice.
• I am not a SEBI-registered advisor.
• The information provided here is based on personal market observation.
• No buy/sell recommendations are being made.
• Please do your own research or consult a registered financial advisor before making any trading decisions.
• Trading involves risk. Always use proper risk management.
{{DATE}}
 Launch your Graphy