There are no items in your cart
Add More
Add More
| Item Details | Price | ||
|---|---|---|---|

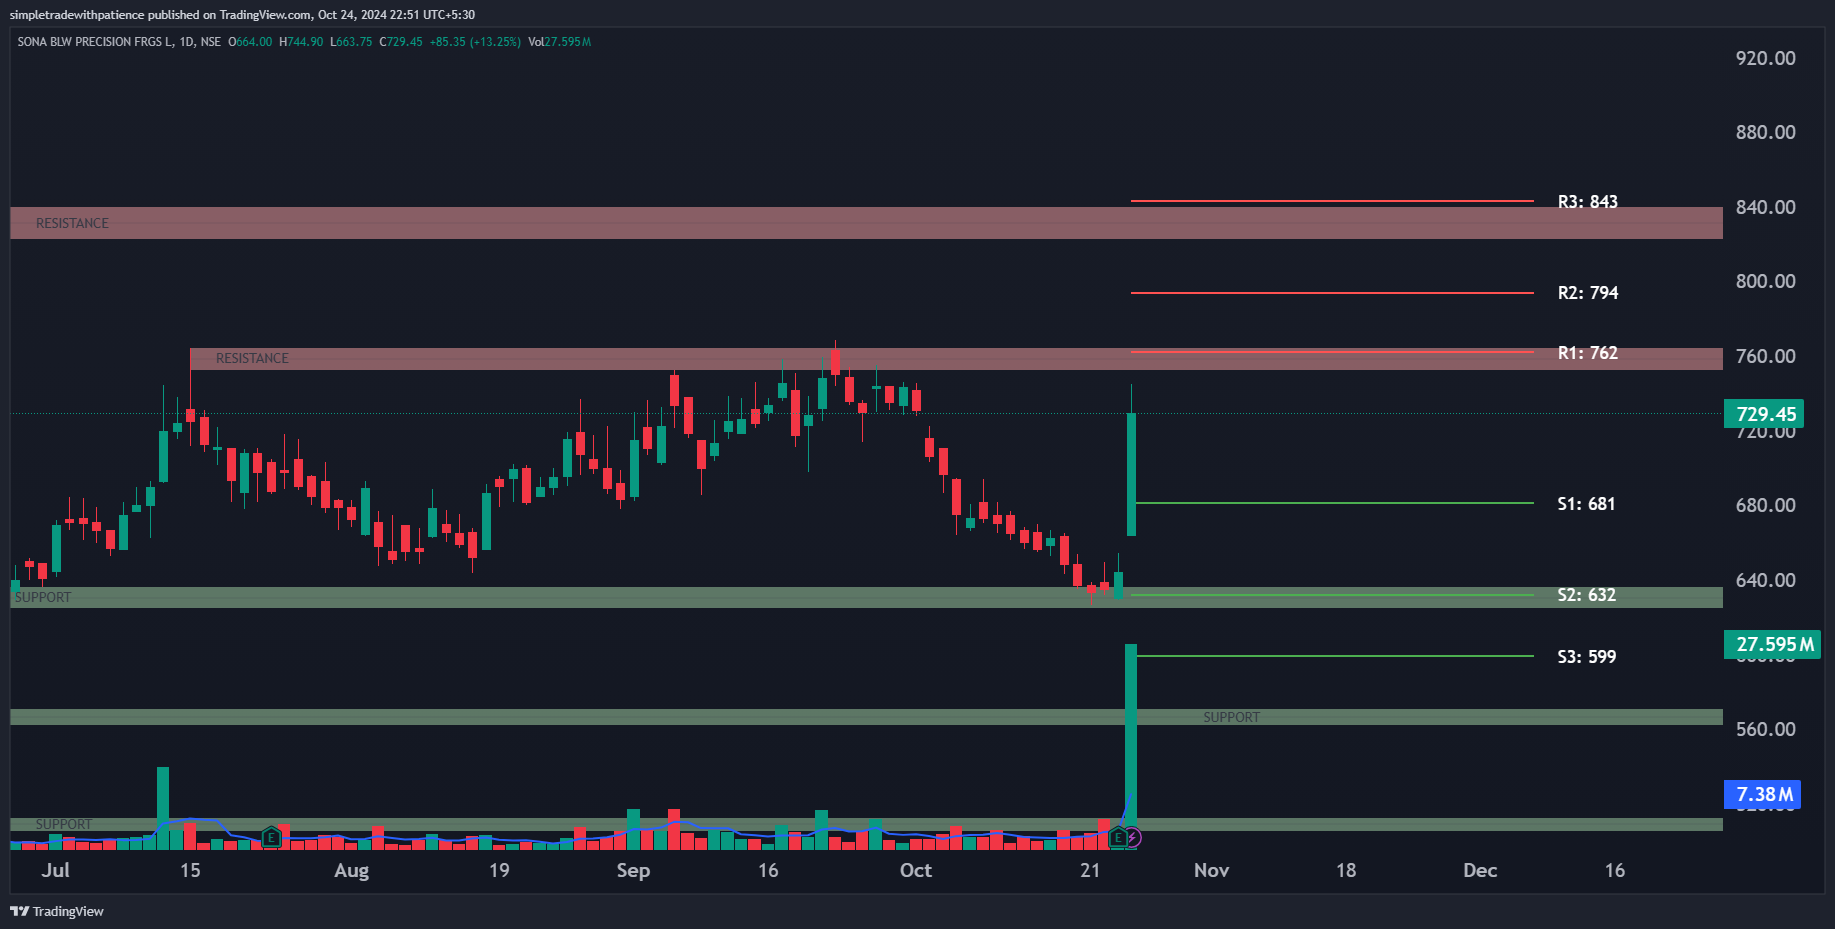
SONACOMS has made an impressive move, closing at 729.45, which represents a sharp rise from its previous day’s close of 644.10. This move has resulted in a 52-week breakout, forming a strong bullish candle, which indicates that buyers have taken control and are pushing the stock higher. One of the key technical signs of strength in SONACOMS is that it’s currently trading above its 50-day, 100-day, and 200-day Exponential Moving Averages (EMAs). Specifically, the 50 EMA is at 688.15, the 100 EMA at 681.45, and the 200 EMA at 657.68. This positioning above key EMAs suggests that the stock is in a solid uptrend, with strong buying momentum supporting the upward move. What’s driving even more confidence in this breakout is the volume and RSI (Relative Strength Index) breakout. The recent price surge was accompanied by a volume breakout, meaning that trading activity increased significantly, which indicates greater market interest in the stock. Increased volume is often a key signal that the breakout has strong support from traders. Alongside this, the RSI has also broken out, which means that the stock’s strength is gaining momentum. A rising RSI, especially if it crosses above 70, points to strong buying pressure and further confirms the bullish outlook. In terms of price levels to watch, several pivot points can help guide traders on where the stock might head next. Resistance levels are important because they indicate where the stock might face selling pressure. For SONACOMS, the first resistance to watch is at R1 (762), followed by R2 (794) and R3 (843). These levels make this stock a potential for a possible swing trade. However, traders should also be mindful of potential support levels where the stock could find a floor if it retraces. The first support level to monitor is at S1 (681), with additional support at S2 (632) and S3 (599). These levels provide potential entry points if the stock pulls back before resuming its bullish trend.
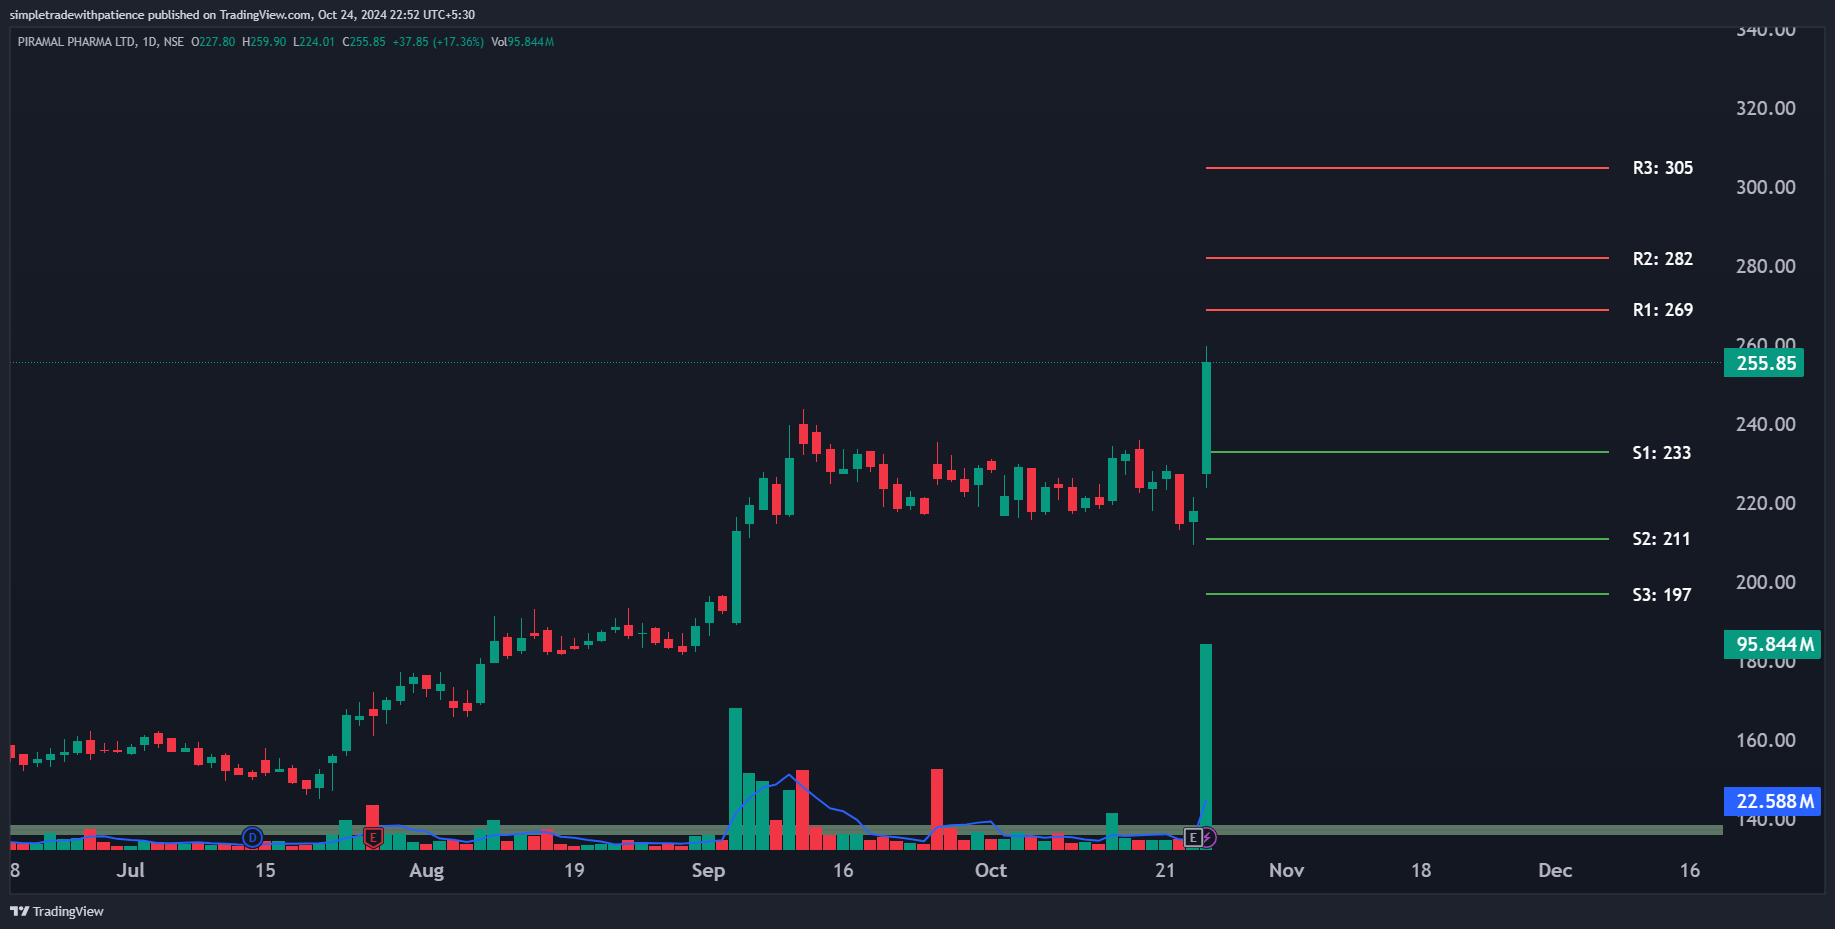
PPLPHARMA is another stock showing strong signs of a breakout, closing at 255.84, significantly higher than its previous day’s close of 217.99. Similar to SONACOMS, PPLPHARMA has also achieved a 52-week breakout, which often signals the beginning of a strong upward trend. This breakout is supported by several bullish indicators, making it a prime candidate for swing traders. PPLPHARMA’s technicals tell a similar story to SONACOMS in that it is trading well above its key EMAs, further supporting the strength of its uptrend. The 50-day EMA stands at 213.36, the 100-day EMA at 194.48, and the 200-day EMA at 171.32. The stock’s current price being above these levels is a strong signal that the bulls are firmly in control. When a stock stays above its longer-term moving averages, it’s typically an indication that the market sentiment is positive and that the stock may continue to rise. Along with the price breakout, PPLPHARMA has also experienced a volume breakout, suggesting that market participants are heavily trading this stock, adding to the conviction behind the breakout. The RSI has also surged, indicating increased momentum behind the price action. When both volume and RSI break out in sync with price, it’s a strong signal that the uptrend has legs to continue. For traders eyeing potential price targets, there are key resistance levels to monitor. The first resistance level to watch is R1 (269), followed by R2 (282) and R3 (305). These levels make this stock a potential for a possible swing trade. On the flip side, should the stock retrace, it’s important to be aware of the support levels at S1 (233), S2 (211), and S3 (197), which could serve as potential buy zones if the price pulls back.
{{DATE}}
 Launch your Graphy