"STWP Technical Analysis: ITI, LT, and CEATLTD - Unveiling Breakout Opportunities and Bullish Momentum!"

🚀 Are You Positioned for the Next Big Breakout? 📊
The market is dynamic, and spotting the right opportunities at the right time can transform the way you trade or invest. Today, we focus on three strong candidates showcasing bullish momentum and promising breakout patterns: ITI Ltd, LT (Larsen & Toubro), and CEATLTD. These stocks are standing out with key technical signals like 52-week highs, volume reakouts, RSI crossovers, and bullish patterns across their respective charts. Whether you're a swing trader, BTST player, or someone looking to capitalize on intraday opportunities, these stocks are worth your attention. In this analysis, we'll break down support & resistance levels, key technical indicators, and potential entry opportunities for these stocks, offering you a clear roadmap for trading decisions.
Let’s dive in and uncover the insights behind these breakout opportunities! 🔍

🚀 ITI: Bullish Momentum with Breakout Potential! 📈

The Setup:
ITI Ltd is on a strong bullish run, making it a hot candidate for short-term breakout plays. With a new six-month high and impressive volume, the stock is trending in a progressive zone. The charts and indicators align perfectly for swing trade, BTST, and even intraday opportunities.
🔥 Key Technical Highlights:
Bullish Candles: Long White Candle and Three Outside Up on the monthly chart—clear bullish signals.
RSI: At 77, breaking out of key resistance zones, showing strong momentum.
Volume Breakout: Price rise supported by good volumes, adding conviction.
Stochastic: At 92, signaling overbought but bullish conditions.
CCI: At a high 307, indicating strong momentum.
MACD: Bullish crossover, confirming the upward trend.
Donchian Bands & Bollinger Bands: Both signal a possible positive breakout.
EMA Analysis:
EMA 50, 100, 200: All trending up with prices following suit, indicating a strong bullish uptrend.
Support & Resistance Levels:
Support: 335, 302, 281
Resistance: 388, 409, 442
📈 The Opportunity:
With strong bullish momentum and technical alignment, ITI is a great pick for those eyeing quick gains. Whether you're a swing trader, BTST enthusiast, or intraday player, this stock is worth your attention.

⚠️ STWP View: While the setup looks promising, keep a close eye on volume for confirmation and manage your risk at key levels.

🚀 LT: Bullish Momentum and a 52-Week High! 📈

The Setup:
Larsen & Toubro (LT) is riding a bullish wave, breaking out to a new one-year high with strong volume. The charts indicate a progressive zone with potential for a swing trade or continued momentum. This stock is an ideal candidate for traders looking to capitalize on market strength.
🔥 Key Technical Highlights:
Bullish Candles: Long White Candle on daily and monthly charts, signaling strong buying interest.
RSI: At 72, breaking into bullish territory and confirming momentum.
Stochastic: At 98, indicating overbought conditions but reinforcing the bullish trend.
CCI: At 174, further affirming strong momentum.
MACD: Bullish crossover, supporting the uptrend.
Volume Breakout: Rising prices backed by rising volume in recent sessions.
Donchian Bands: New high created, indicating breakout potential.
Bollinger Bands: Positive breakout, suggesting further upside.
EMA Analysis:
EMA 50: Trending up with price following suit, confirming a strong uptrend.
EMA 100 & 200: Both bullish crossovers, but caution is advised as volatility may increase.
Support & Resistance Levels:
Support: 3890, 3833, 3798
Resistance: 3981, 4016, 4073
📈 The Opportunity:
LT is showing bullish momentum across multiple indicators. With a 52-week high and price supported by volume, this is a stock to watch for swing trades or short-term plays.

⚠️ STWP View: Watch for volatility near resistance levels and manage your positions accordingly. Volume confirmation will be key to sustaining the breakout.

🚀 CEATLTD: Bullish Momentum with a 52-Week High! 📈

Why It’s Hot Right Now:
CEAT Ltd has hit a new one-year high, backed by strong volume and solid technicals, making it an excellent candidate for short-term breakouts, swing trades, BTST, or intraday opportunities.
🔥 Key Technical Highlights:
RSI: At 76, breaking out and indicating strong upward momentum.
Stochastic: At 81, supporting the bullish trend in the progressive zone.
CCI: At 215, confirming robust momentum.
MACD: Bullish crossover, signaling further upside potential.
Volume Breakout: Rising prices supported by strong volume, adding confidence.
Donchian Bands: New high created, suggesting a breakout is imminent.
Bollinger Bands: Positive breakout confirms bullish strength.
Bullish Patterns: Bullish Gap Up and Bullish Kicker on the daily chart—strong reversal signals.
EMA Analysis:
EMA 50, 100, 200: All trending upward with prices above them, confirming a strong bullish trend.
Caution: Volatility may increase near resistance zones—watch for signs of consolidation.
Support & Resistance Levels:
Support: 3238, 3061, 2892
Resistance: 3585, 3755, 3932
📈 The Opportunity:
CEATLTD is demonstrating bullish momentum with multiple breakout signals. Whether you're looking for a swing trade, BTST, or intraday play, the setup looks promising for short-term gains.

⚠️ STWP View: Manage your risk by monitoring volume at key resistance levels and setting appropriate stop-loss levels.


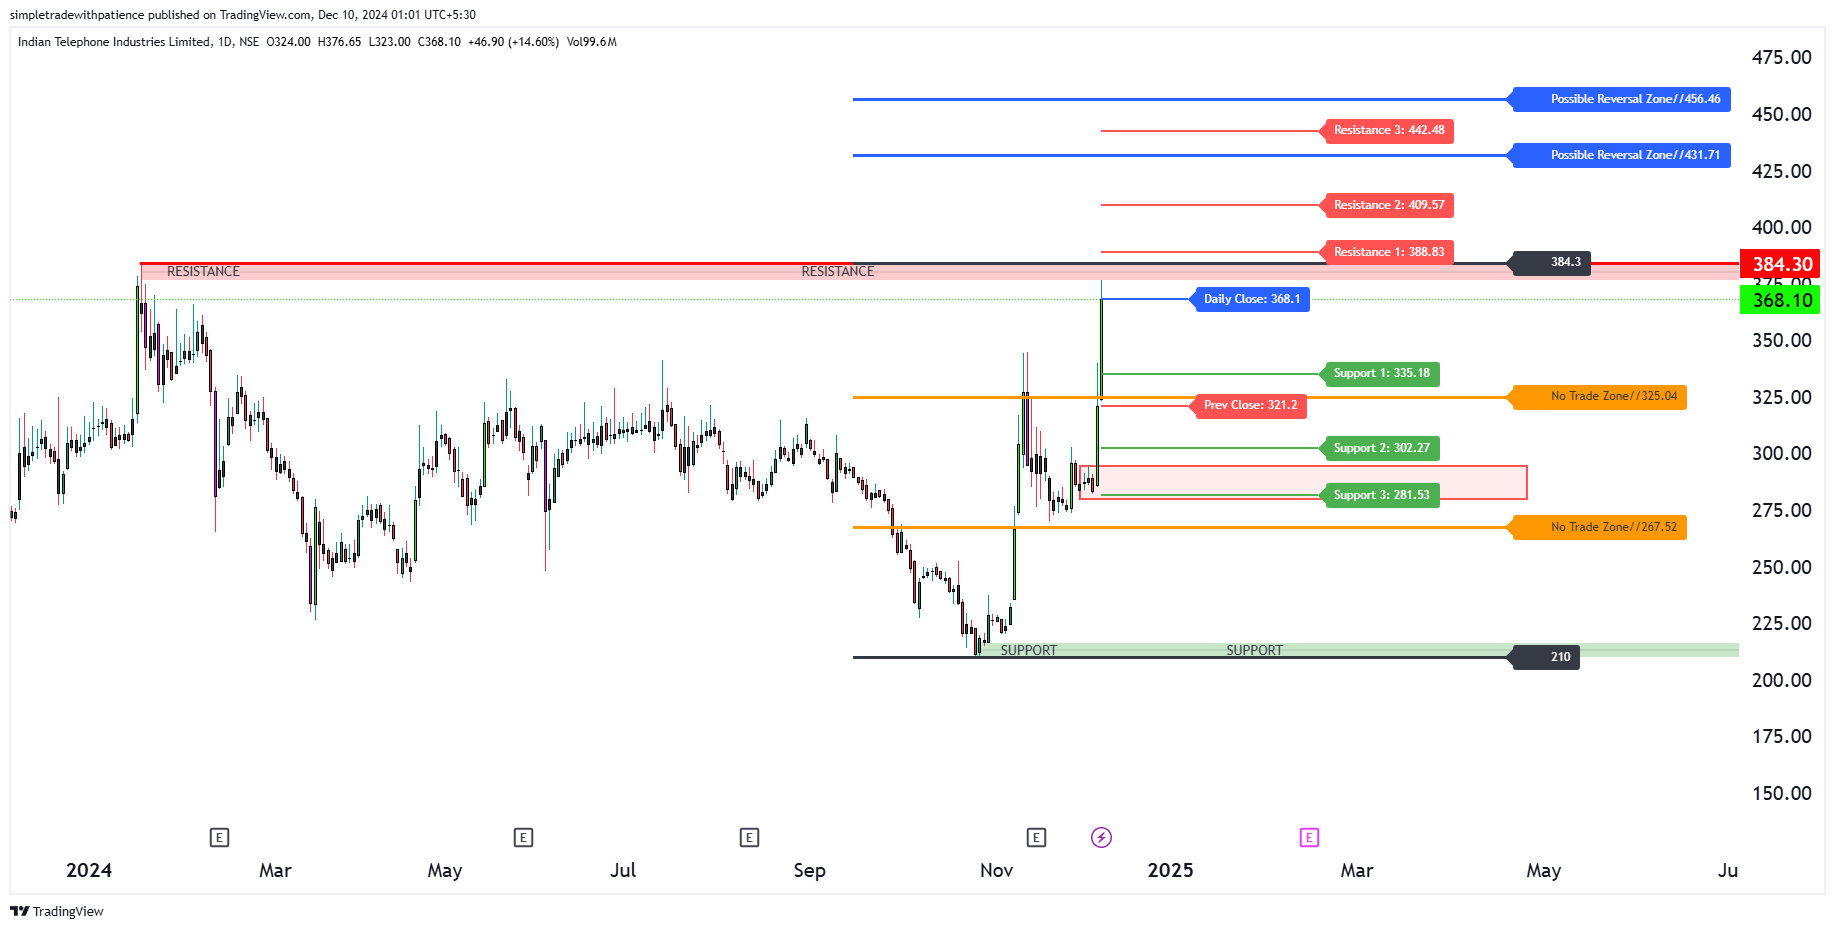
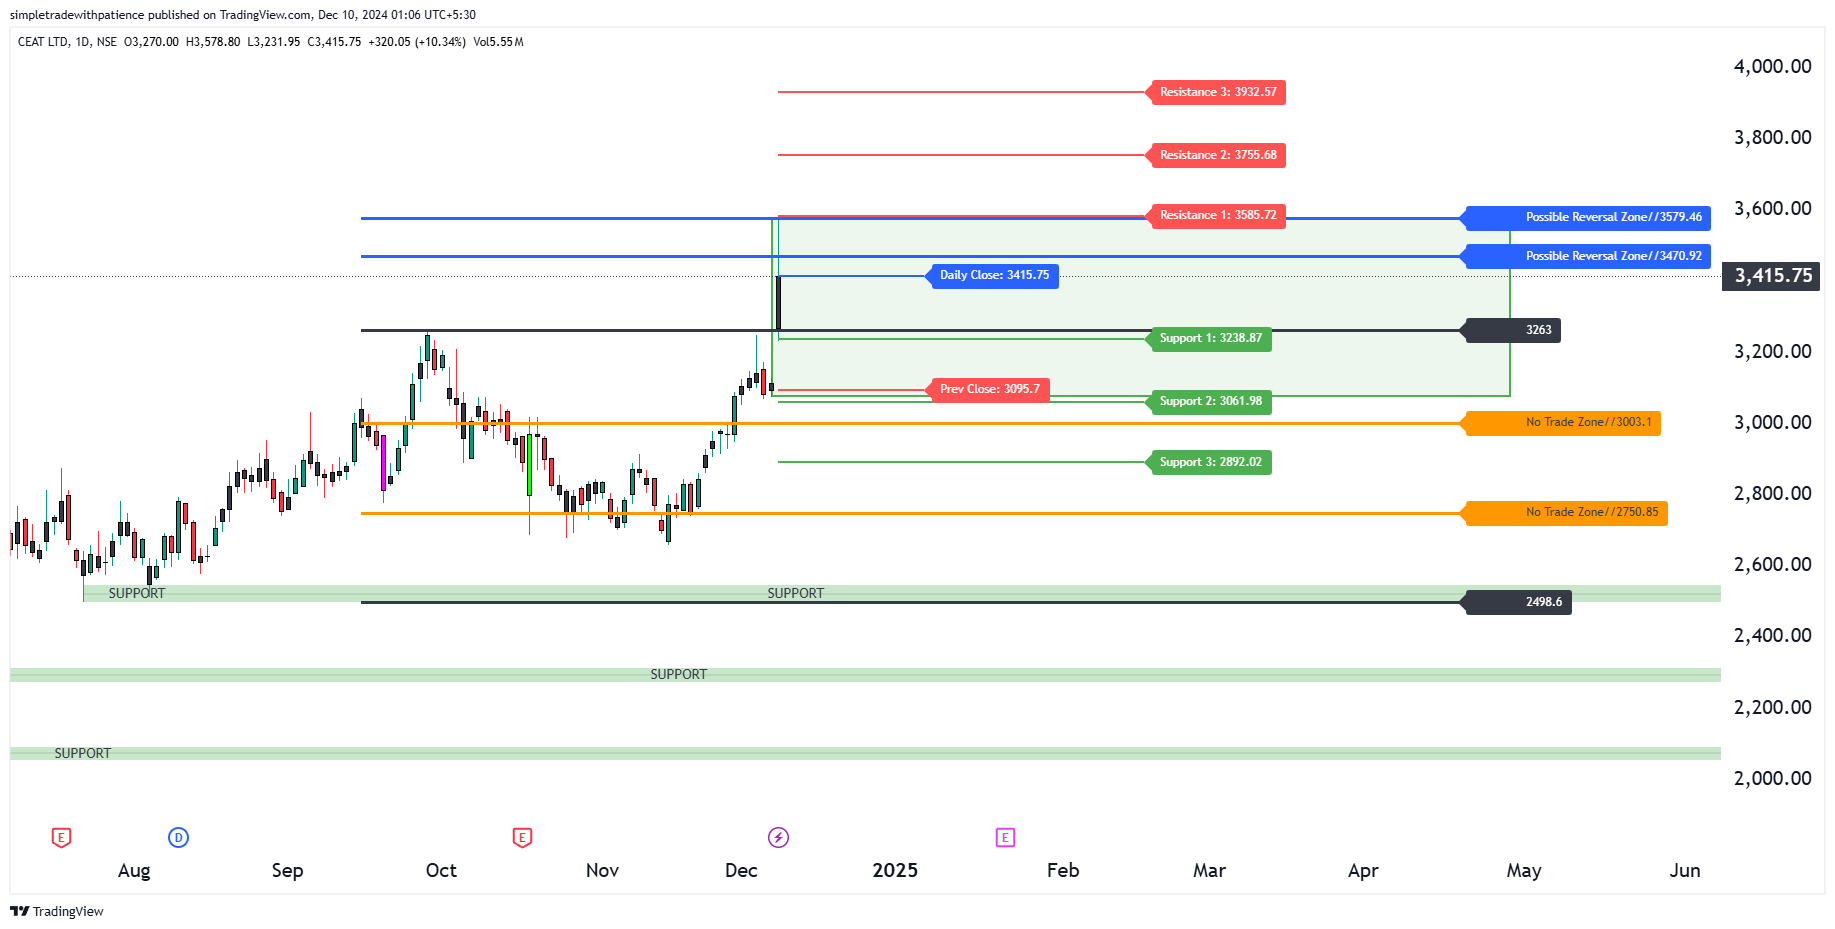
🔔 Conclusion: The technical analysis of ITI, LT, and CEATLTD reveals strong bullish momentum and breakout opportunities across these key stocks. Each stock is showing promising signals—ranging from volume breakouts, RSI movements, and positive EMA trends—that suggest potential for short-term gains through swing trades, BTST, or intraday strategies.

📊 Ready to Trade the Momentum? - Don’t miss out on these opportunities! Set alerts for ITI, LT, and CEATLTD on your TradingView to stay ahead of market moves.
👉 Subscribe to STWP for daily market insights and technical opportunities!
🔔 Turn on notifications and never miss a breakout signal again!
💡 STWP View: Always confirm your entries with real-time volume and maintain disciplined stop-loss strategies.Trade smart. Stay informed.
With STWP by your side, ride the trends with confidence. 📈