There are no items in your cart
Add More
Add More
| Item Details | Price | ||
|---|---|---|---|

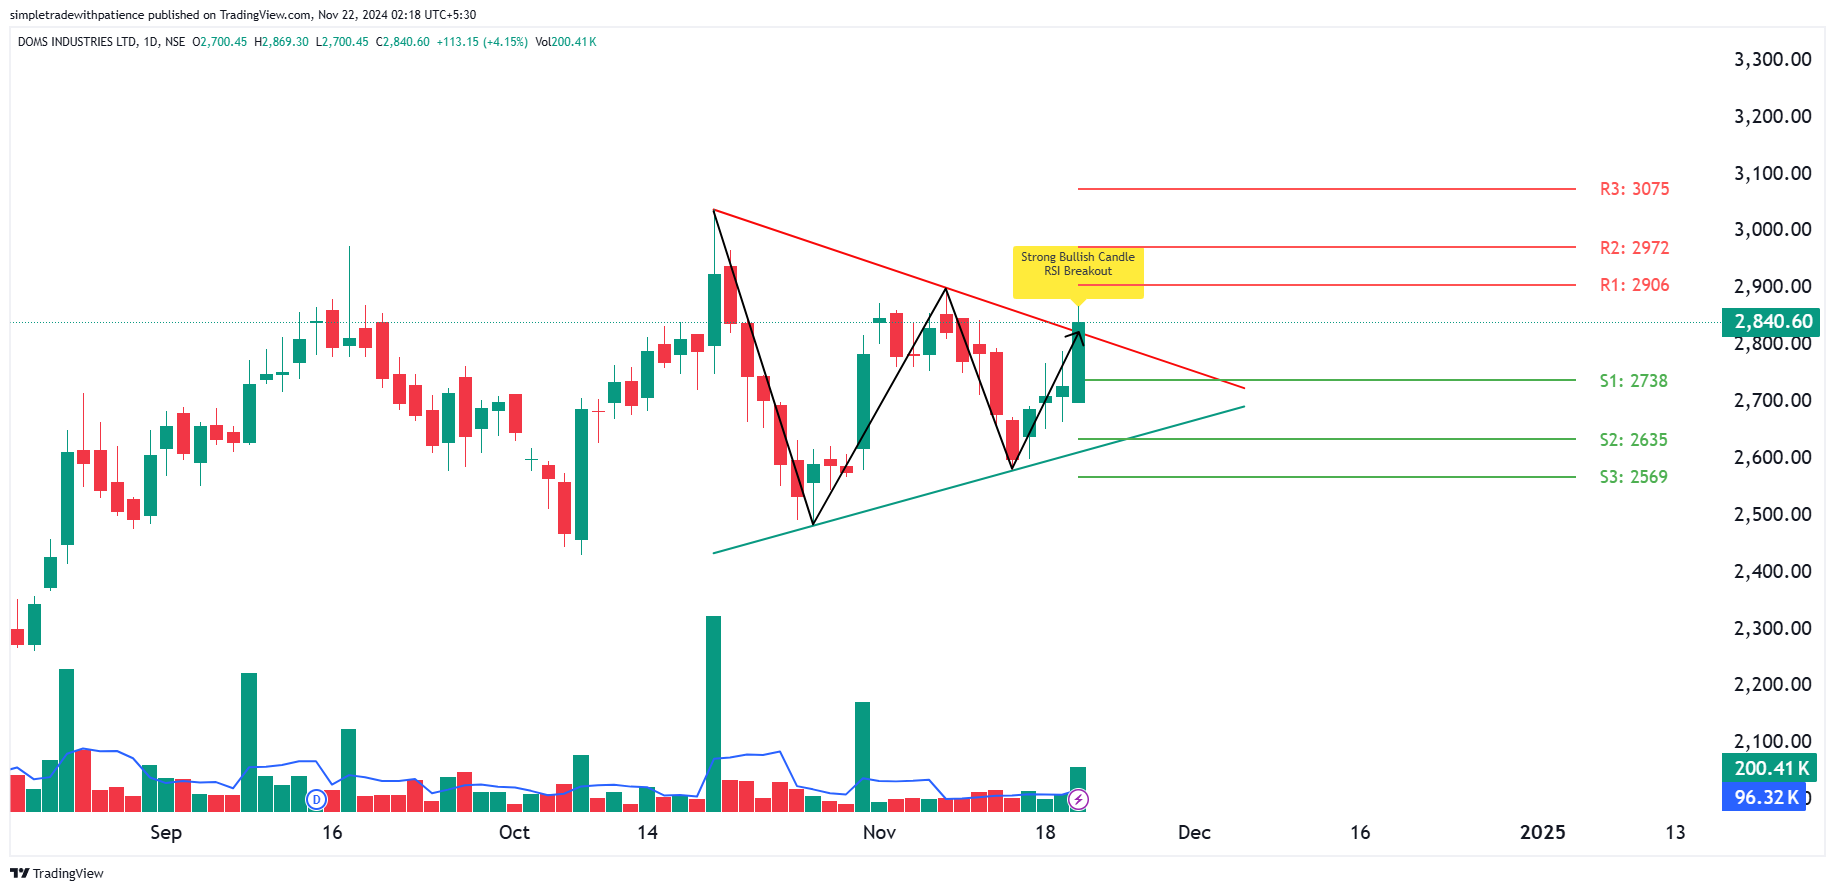
Stock Overview: DOMS opened today at ₹2700.45 and has reached a high of ₹2869.3, showcasing significant intraday movement. It closed at ₹2840.6, marking a solid gain from the previous day’s close of ₹2727.45. Today's trading volume was 200,410 shares, a sharp increase compared to the previous day’s volume of 79,020 shares, indicating strong market participation.
Key Levels to Watch:
EMA Analysis:
Trend Analysis: The current price is comfortably above the 50-day EMA, suggesting short-term bullish momentum. DOMS is trading closer to its R1 resistance of ₹2906. Traders should keep an eye on how the stock performs near this resistance for possible breakout opportunities. If DOMS sustains above ₹2840, the next potential move could test higher levels.
Volume Analysis: Today's surge in volume (200,410 shares) indicates that market participants are actively trading the stock, possibly anticipating a breakout. A continuation of high volumes would suggest strong buyer interest.
Conclusion: DOMS is currently showing a positive trend, with a possible bullish outlook as long as it holds above ₹2676 (50-day EMA). Traders may look for possible breakout opportunities around the R1 level of ₹2906. However, any significant dip below the support levels could signal a possible change in trend, so watch closely.
Disclaimer: The analysis above is for informational purposes only. It does not constitute investment advice. Please consult a financial advisor or do your own research before making any investment decisions. The stock market is subject to risks, and past performance is not indicative of future results. The author holds no responsibility for any losses incurred. This article is based on publicly available information and is compliant with SEBI regulations.
{{DATE}}
 Launch your Graphy