There are no items in your cart
Add More
Add More
| Item Details | Price | ||
|---|---|---|---|

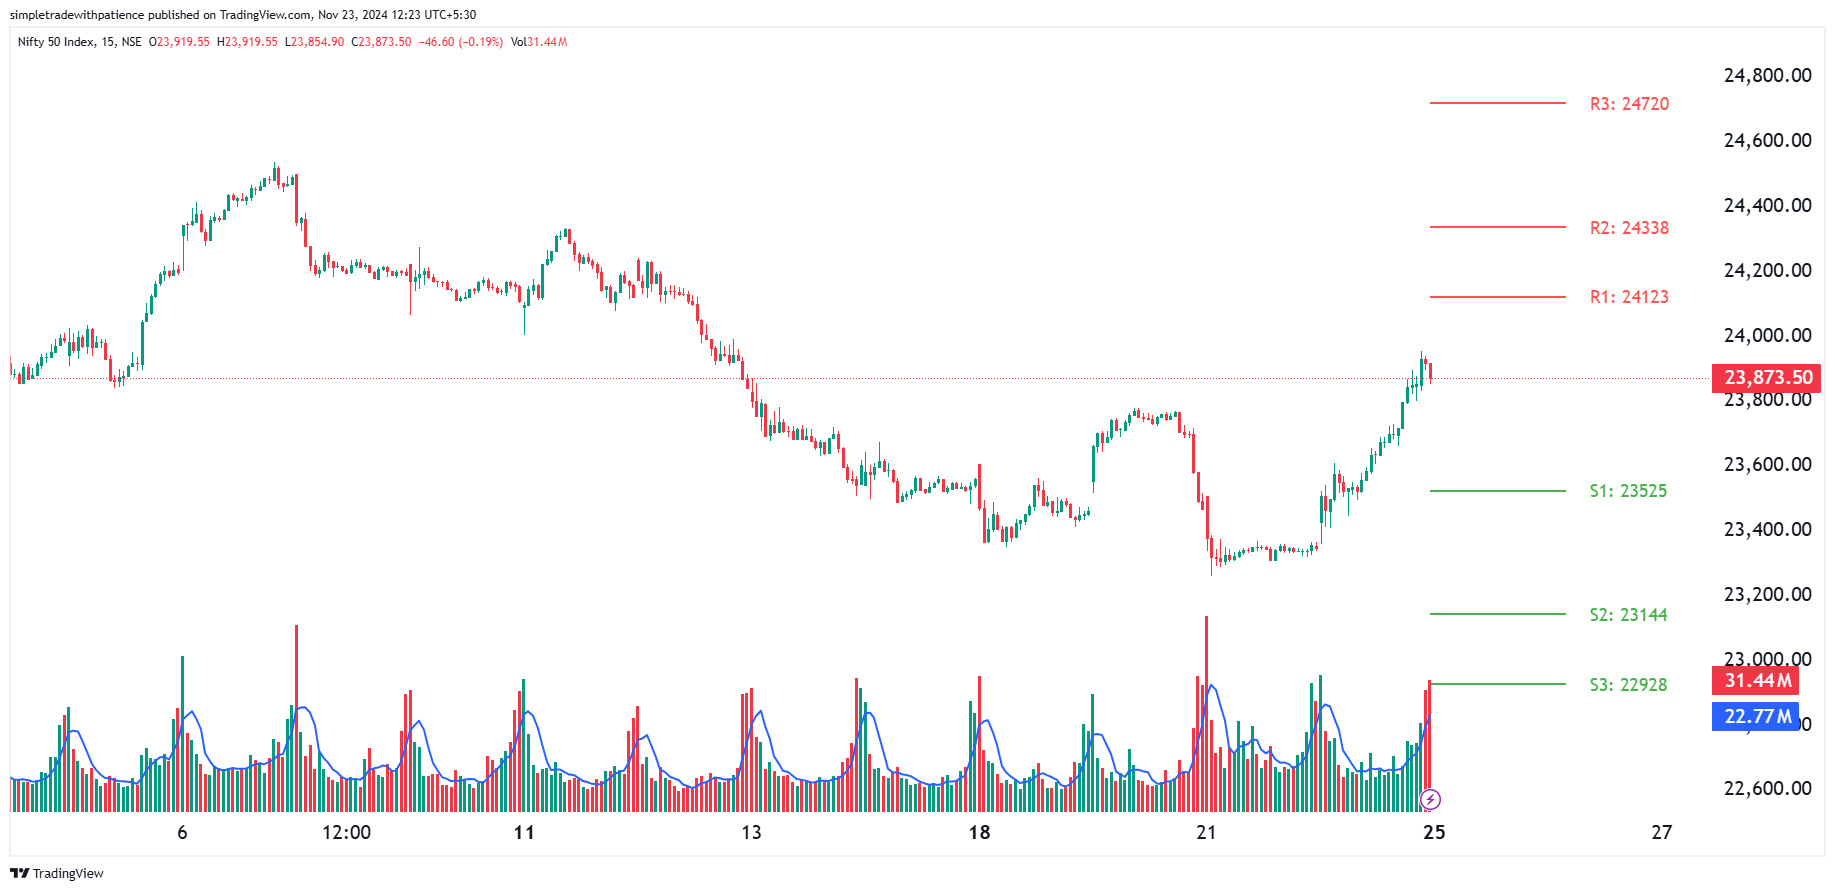
Trend Analysis: The Nifty index closed at 23,907.25, showing a notable increase from the previous day's close of 23,349.90. This indicates a bullish short-term momentum. However, the current price is still trading below the 50-day exponential moving average (EMA) of 24,417.62, signaling a potential resistance at this level. The Nifty is currently positioned above the 200-day EMA (23,542.78), which suggests a long-term uptrend.
Technical Analysis: The Nifty has a positive bias in the short-term, with the close above both the 100-day EMA (24,323.94) and 200-day EMA (23,542.78). The immediate resistance levels lie at R1 (24,123) and R2 (24,338), while R3 is located at 24,720. If Nifty surpasses R2, a further uptrend could be expected. On the downside, S1 is seen at 23,525, followed by S2 at 23,144 and S3 at 22,928.
Resistance: 24,123 (R1), 24,338 (R2), 24,720 (R3).
Support: 23,525 (S1), 23,144 (S2), 22,928 (S3).
Analysis: Given the current technical setup, the Nifty is facing resistance around the 24,100-24,300 range, and a possible breakout above this zone could lead to a further rally towards 24,700. On the flip side, any dip towards 23,500 should be closely monitored as a potential buy opportunity(possible) if supported by volume and market conditions.
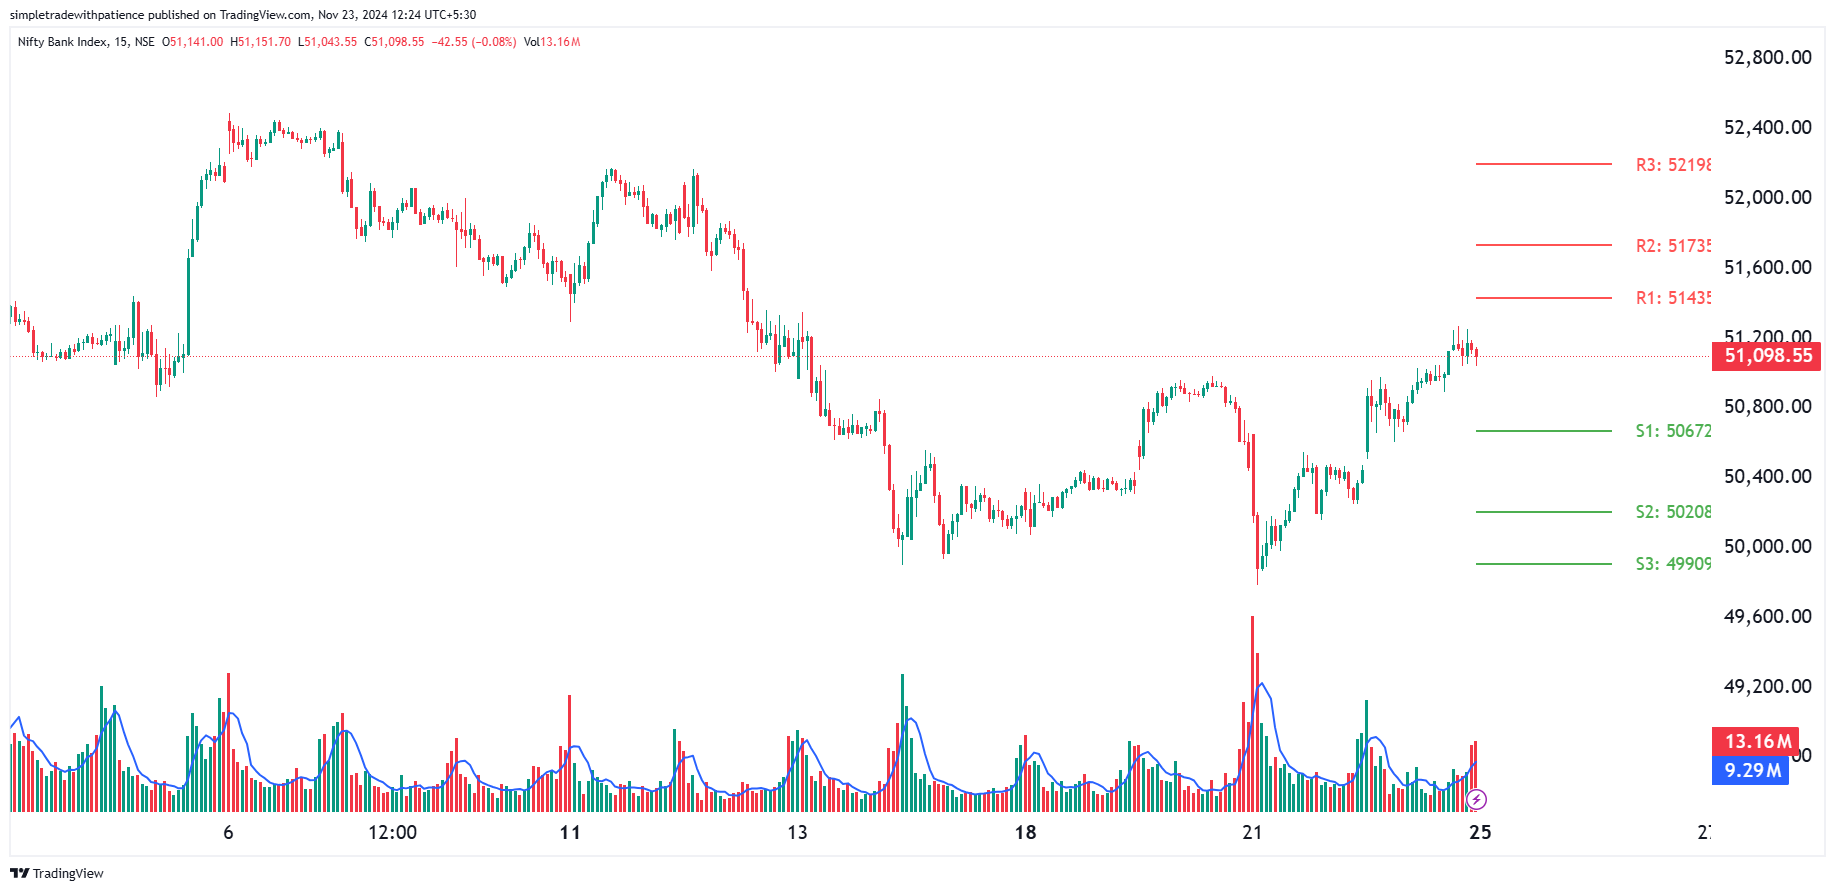
Trend Analysis: The Bank Nifty has shown strong bullish momentum, closing at 51,135.4, up from 50,372.9. The index is trading above both the 50-day EMA (51,440.14) and 200-day EMA (49,933.97), which are indicative of a healthy bullish trend. The short-term support lies near the 50-day EMA, and the recent price action suggests that Bank Nifty may continue to outperform broader indices in the near term.
Technical Analysis: The immediate resistance levels are seen at R1 (51,435), R2 (51,735), and R3 (52,198). On the support side, the first support is at S1 (50,672), followed by S2 (50,208) and S3 (49,909). Bank Nifty is exhibiting a strong uptrend, and should it breach R2 at 51,735, the index could test R3 at 52,198.
Resistance: 51,435 (R1), 51,735 (R2), 52,198 (R3).
Support: 50,672 (S1), 50,208 (S2), 49,909 (S3).
Analysis: The Bank Nifty remains bullish with key support levels providing a solid base for potential upward movement. Any correction near S1 (50,672) could offer possible buying opportunities. A breakout above 51,735 could possibly push the index to test 52,198 in the coming days, maintaining its upward trajectory.
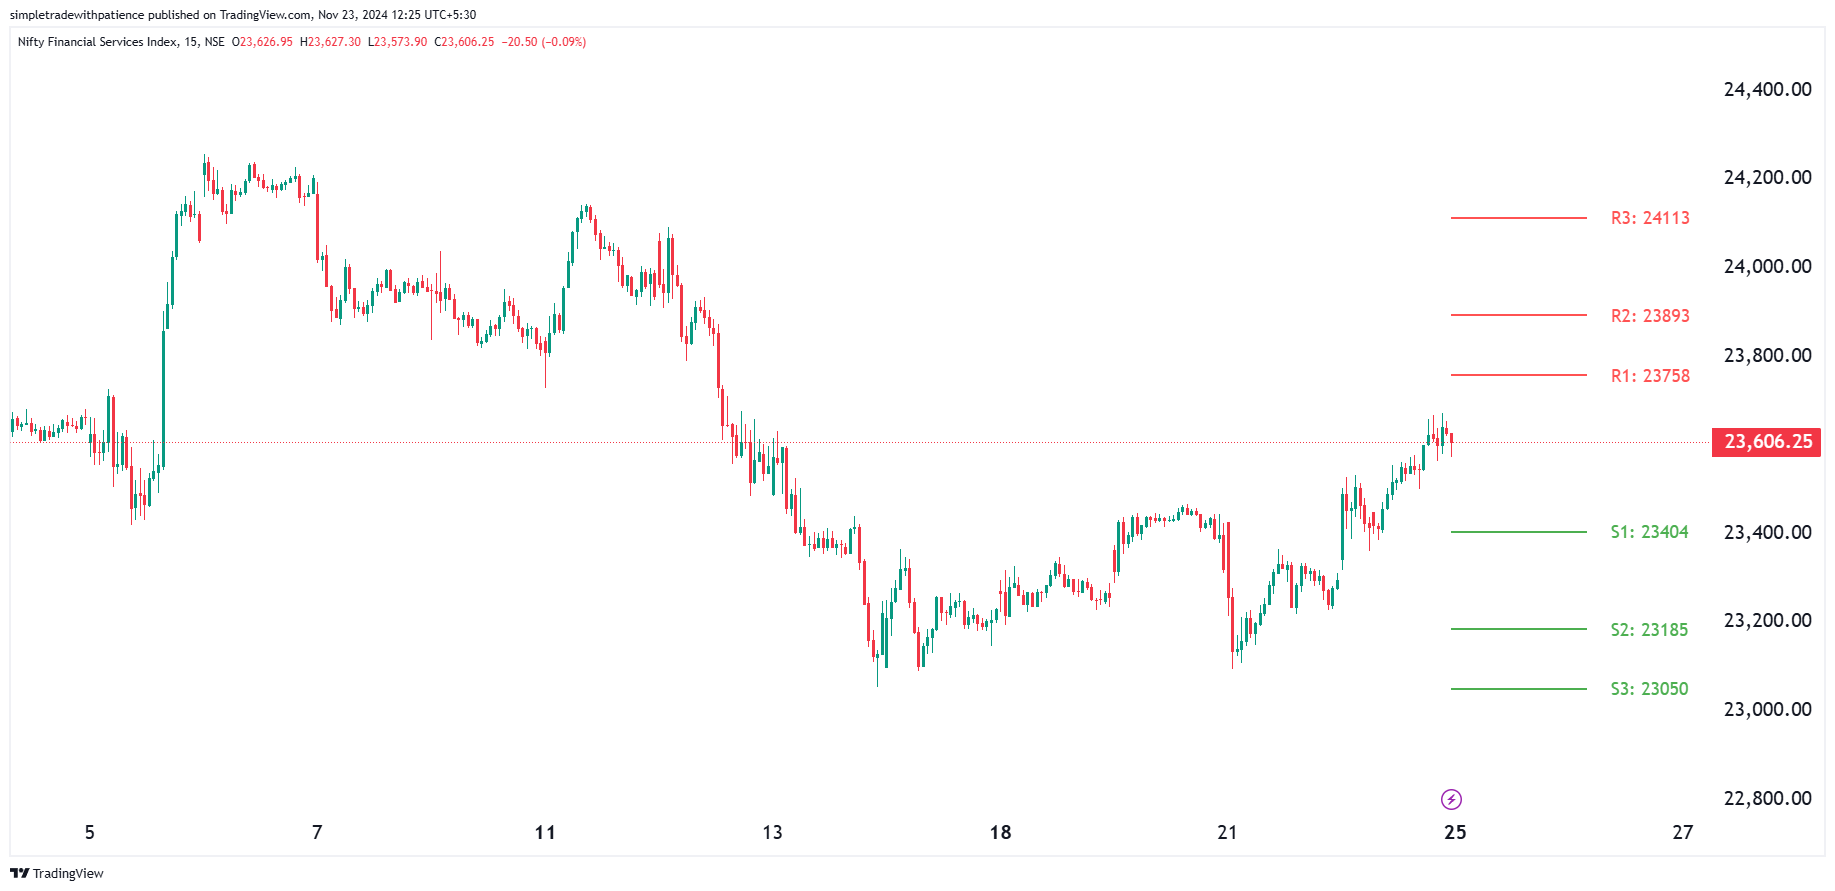
Trend Analysis: The Nifty Financial Services index (Finnifty) closed at 23,623.75, up from the previous close of 23,273.45, showing a positive near-term bias. The Finnifty is also positioned above the 50-day EMA (23,726.07), indicating a bullish outlook, although it is still trading below the 100-day EMA (23,450.04). The index is relatively stronger compared to Nifty, with the 200-day EMA at 22,700.39, providing strong support for any potential dips.
Technical Analysis: Resistance levels for Finnifty are at R1 (23,758), R2 (23,893), and R3 (24,113). On the downside, the support levels are located at S1 (23,404), S2 (23,185), and S3 (23,050). Given the current uptrend, a break above R2 at 23,893 could pave the way for the index to target R3 at 24,113.
Resistance: 23,758 (R1), 23,893 (R2), 24,113 (R3).
Support: 23,404 (S1), 23,185 (S2), 23,050 (S3).
Analysis: Finnifty shows a positive trend with clear resistance at 23,893. If the index manages to break through this level, it could possibly extend its rally towards 24,113. On the downside, any pullback towards 23,400 could present a possible buying opportunity, with the long-term outlook remaining positive due to the index's positioning above its 50-day EMA.
The Nifty, Bank Nifty, and Finnifty are all showing strong bullish tendencies in the near term, with clear resistance and support levels guiding their movement. While Nifty is testing critical resistance zones, Bank Nifty and Finnifty seem to be in better positions for a continued uptrend, especially if they breach their respective resistance levels. Investors and traders should monitor these key levels closely for potential entry and exit opportunities.
Disclaimer:
The views and opinions expressed in this article are solely those of the author and are based on the analysis of historical market data and technical indicators. This article is for informational purposes only and should not be construed as financial or investment advice. While efforts have been made to provide accurate and up-to-date information, the author, and the website disclaim any responsibility for any errors or omissions in the content. Investors should consult with a qualified financial advisor or conduct their own research before making any investment decisions. Stock market investments are subject to market risks, and past performance is not indicative of future results. The author and the website do not hold any responsibility for the financial outcomes resulting from the use of this analysis. This content is in compliance with SEBI (Securities and Exchange Board of India) regulations and is not intended as a recommendation for any specific stock or financial product.
{{DATE}}
 Launch your Graphy