There are no items in your cart
Add More
Add More
| Item Details | Price | ||
|---|---|---|---|

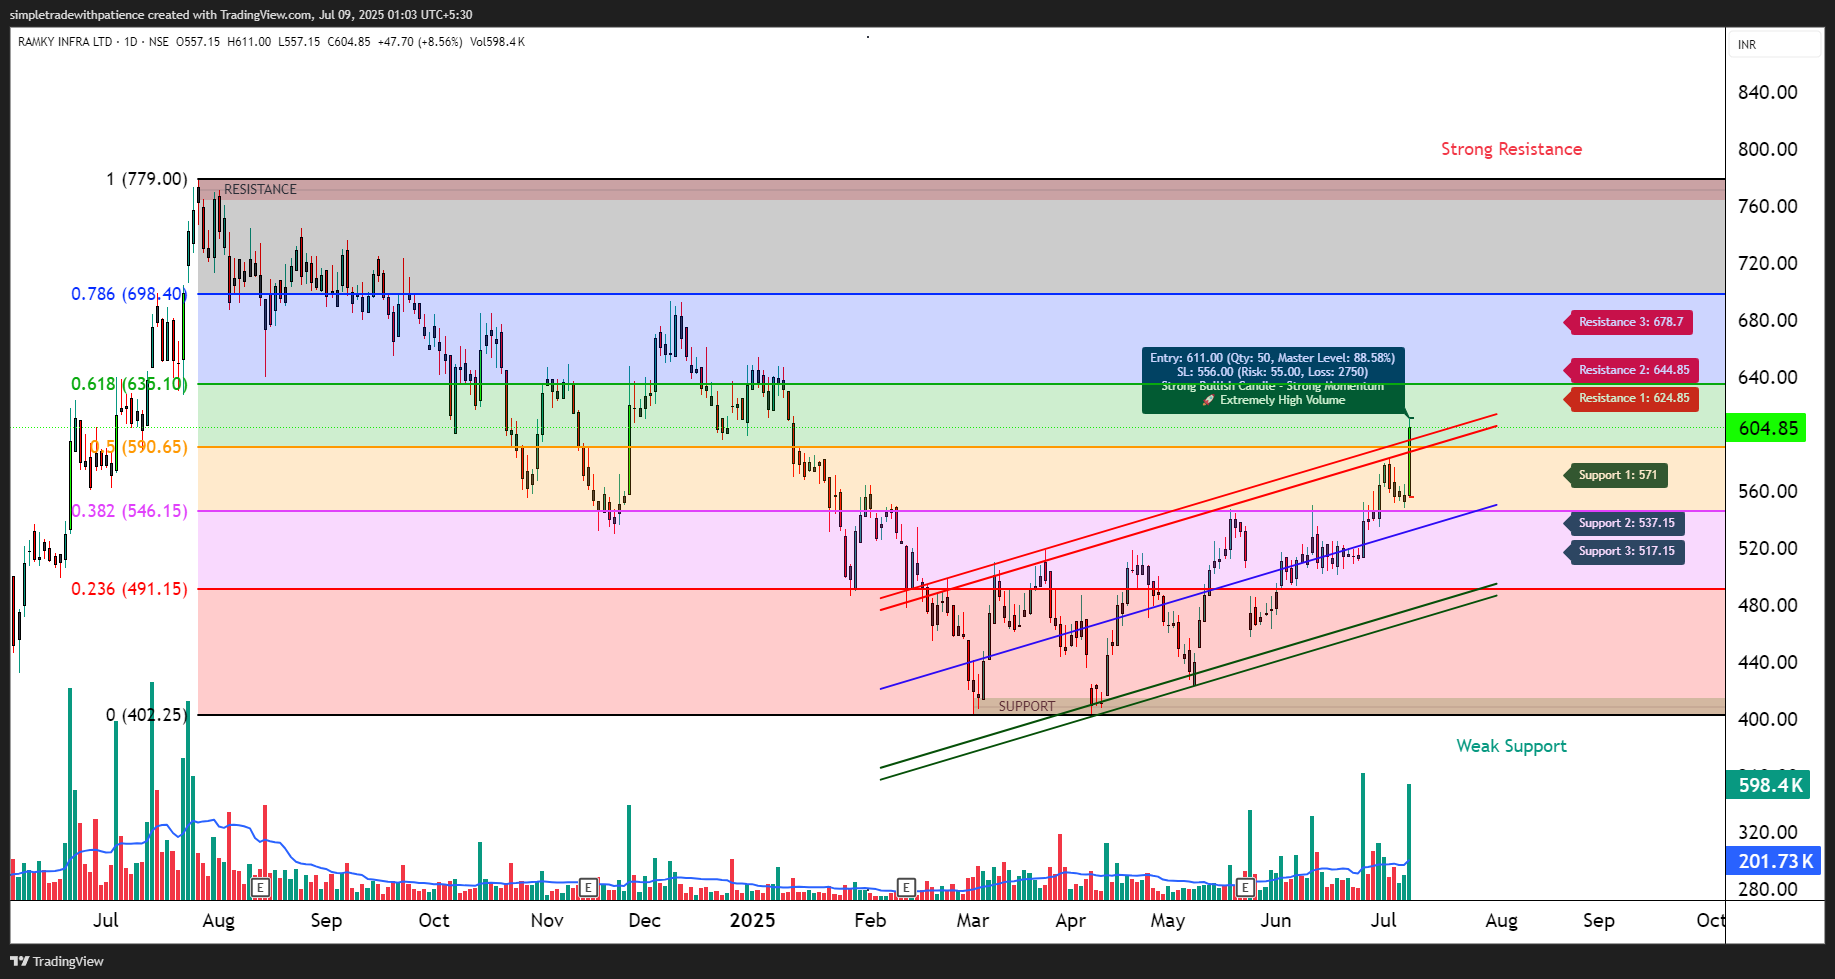
📊 RAMKY INFRA – High Volume Breakout Near Golden Ratio | Fib + Channel Analysis
📌 Chart Context:
RAMKY INFRA is attempting a strong breakout above the golden Fibonacci zone (0.618 at ₹636.10) after registering a sharp move of +8.56% today with extremely high volume, indicating strong institutional activity.
🔁 Trend Bias:
📈 Bullish, supported by consistent higher highs and higher lows inside an ascending channel. Price is respecting mid-term bullish structure since April 2025.
📍 Key Technical Levels:
🔍 What’s Catching Our Eye:
🧠 Trade Logic:
A bullish continuation pattern with confirmation via Fibonacci confluence, channel support, and volume. The stock has potential to scale toward ₹644–₹678 zone if it sustains above ₹611 and manages to hold ₹571 as base.
⚠️ Note: Avoid chasing price if already moved too far from entry. Wait for intraday dips toward ₹590–₹600 for favorable R:R setups..
⚠️ Disclaimer (Please Read):
• This chart is shared for educational purposes only and is not investment advice.
• I am not a SEBI-registered advisor.
• The information provided here is based on personal market observation.
• No buy/sell recommendations are being made.
• Please do your own research or consult a registered financial advisor before making any trading decisions.
• Trading involves risk. Always use proper risk management.
{{DATE}}
 Launch your Graphy