There are no items in your cart
Add More
Add More
| Item Details | Price | ||
|---|---|---|---|

Welcome to today’s market insights, brought to you by STWP. Are you ready to navigate the twists and turns of the market? Whether you're just starting or have some experience, understanding key levels and price action is crucial to making informed trading decisions. In today's analysis, we break down Nifty, Bank Nifty, and Finnifty with simple, actionable insights to help you trade smarter. Let's dive in and explore what the market is telling us today!
Nifty AnalysisOverview
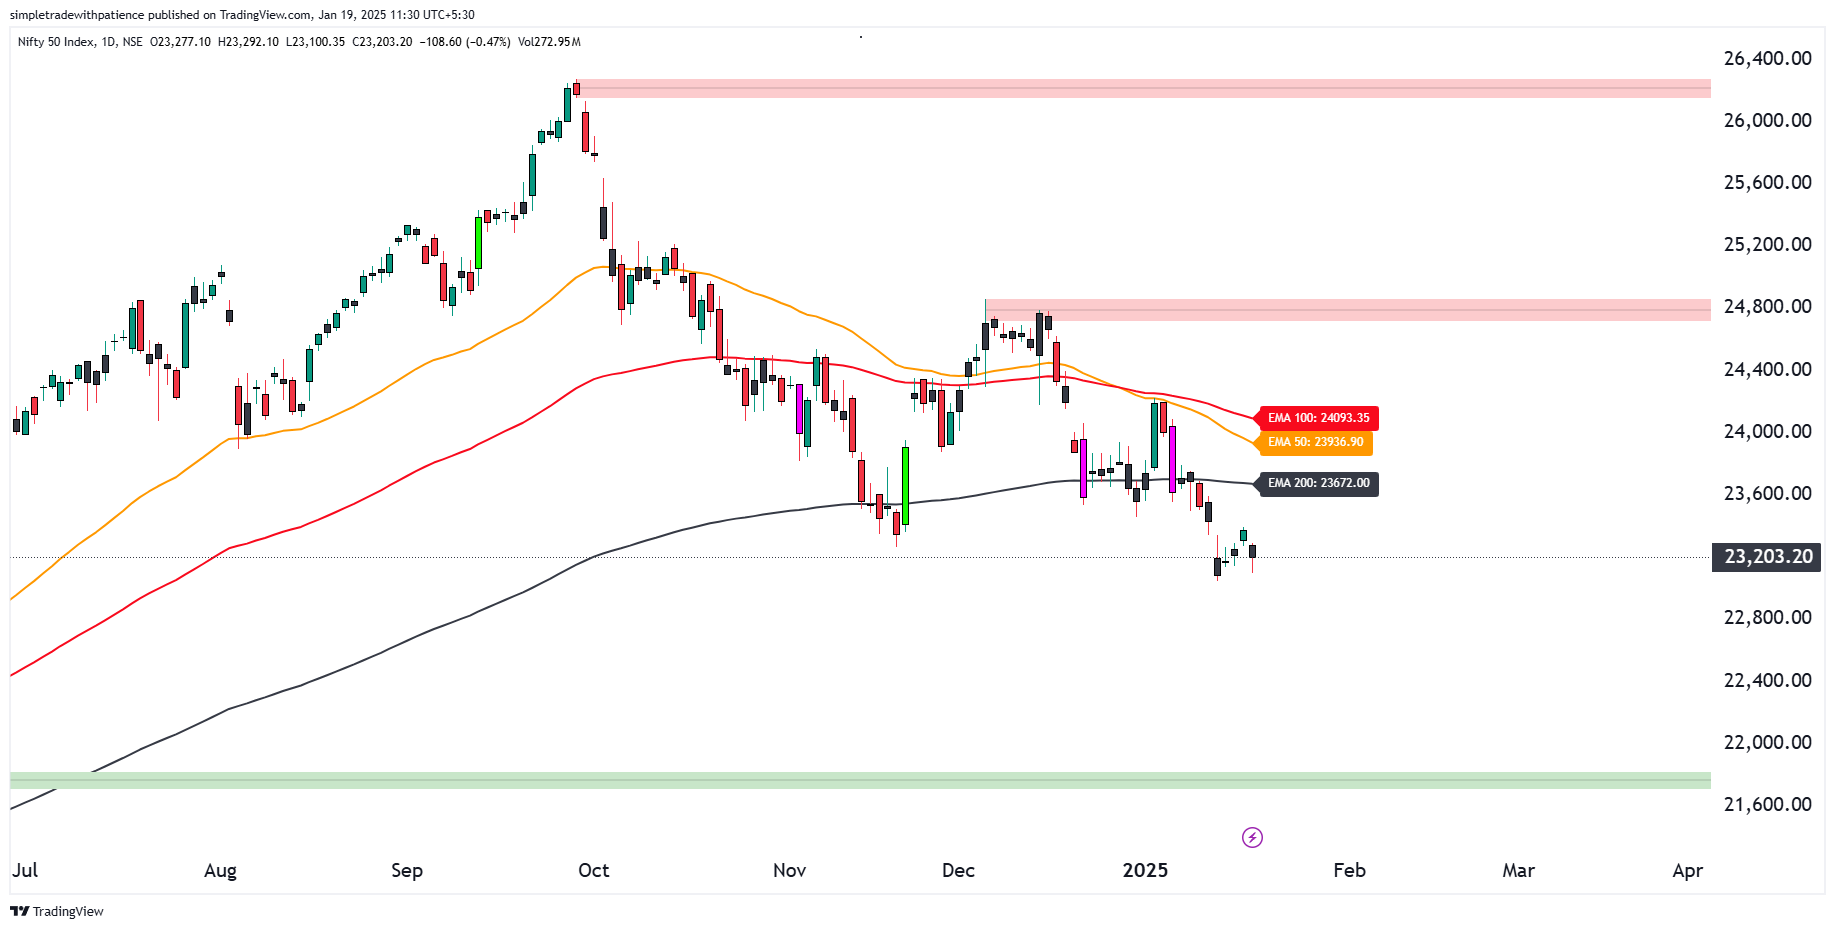
Nifty closed at 23203.2, marking a decline from the previous close of 23311.8. This shows a bearish movement, reflecting a cautious sentiment among traders. Despite a brief recovery attempt during the day, it failed to sustain near higher levels.
EMA Insights
The current close of 23203.2 is well below the 50-day EMA (23936.9), 100-day EMA (24093.34), and 200-day EMA (23671.99). This indicates that bearish momentum is likely to continue unless the index shows a strong reversal and closes decisively above these moving averages. Traders should be cautious in the short term and watch for any signs of trend reversal near these key EMAs.
Key Levels
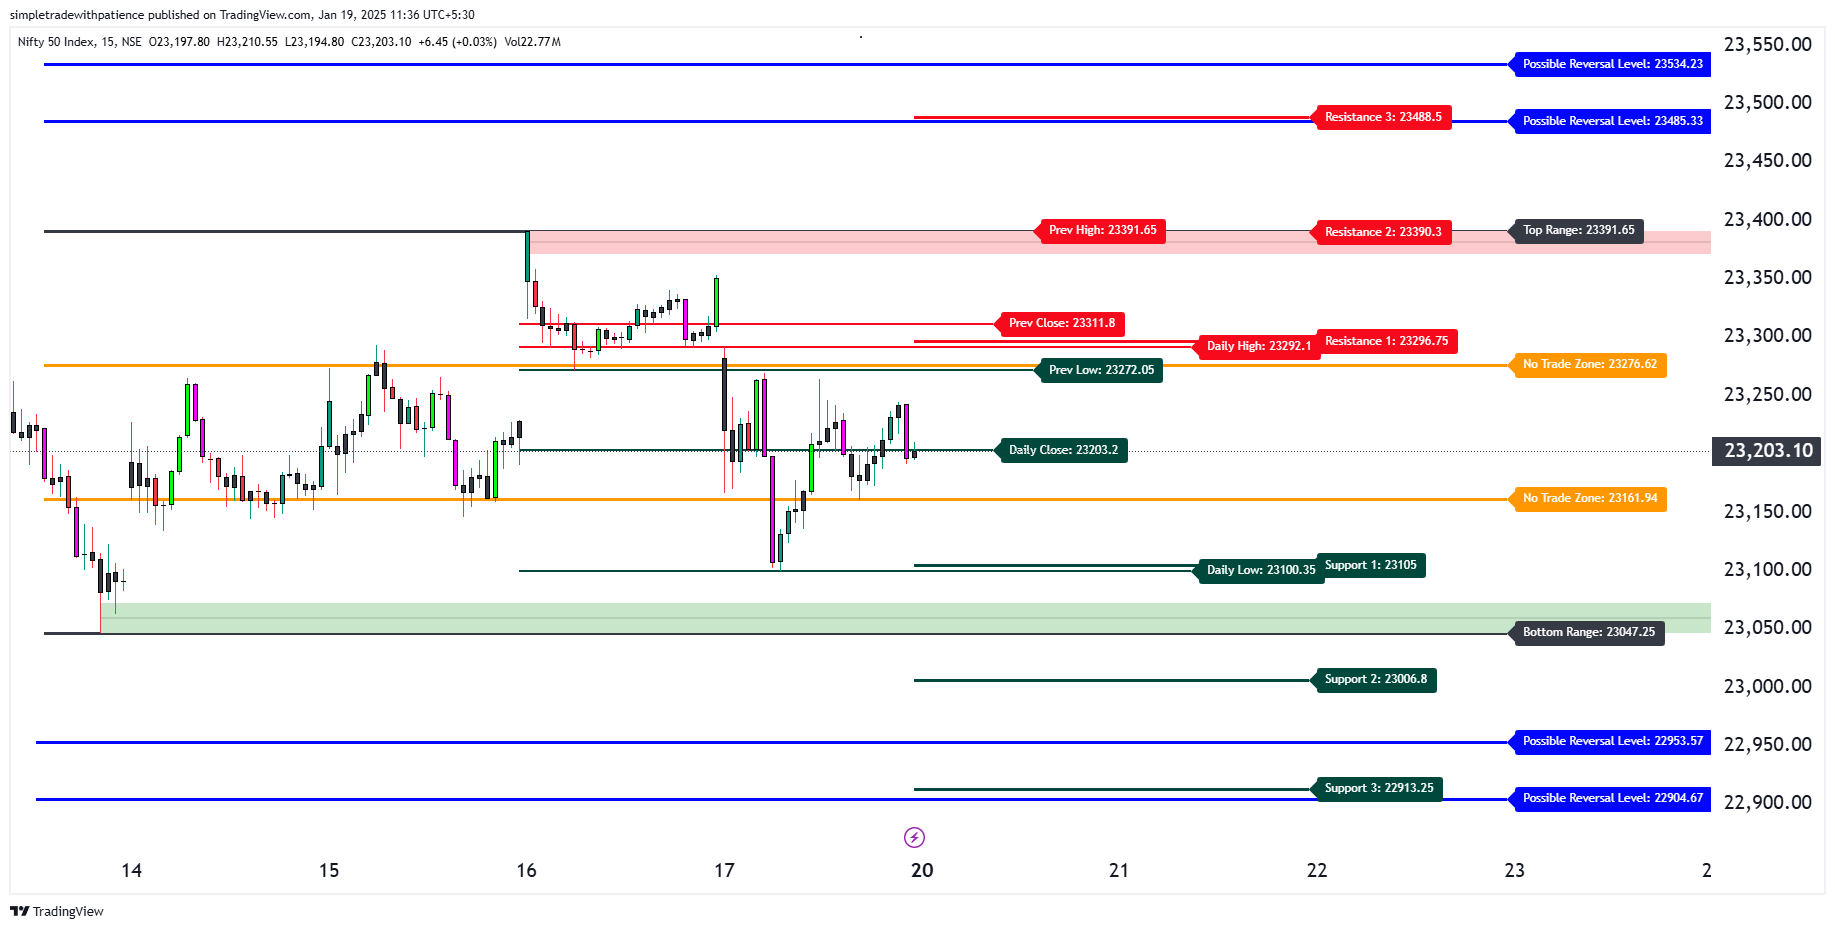
Resistance: Immediate resistance is noted at 23296.75, followed by stronger barriers at 23390.3 and 23488.5. If there’s a pullback, these levels will act as hurdles that traders should watch out for. A break above these could signal a short-term recovery.
Support: On the downside, Nifty finds support at 23105, 23006.8, and 22913.25. If the price breaks below these levels, it could trigger further selling pressure, pushing the index lower.
Technical Outlook
Nifty remains below key moving averages, signaling strong bearish momentum. Intraday traders should watch 23105 (support) and 23296.75 (resistance) for opportunities. A breakout above resistance or a breach of support could indicate further moves. Positional traders should wait for confirmation of a reversal or breakdown before acting.
Banknifty AnalysisOverview
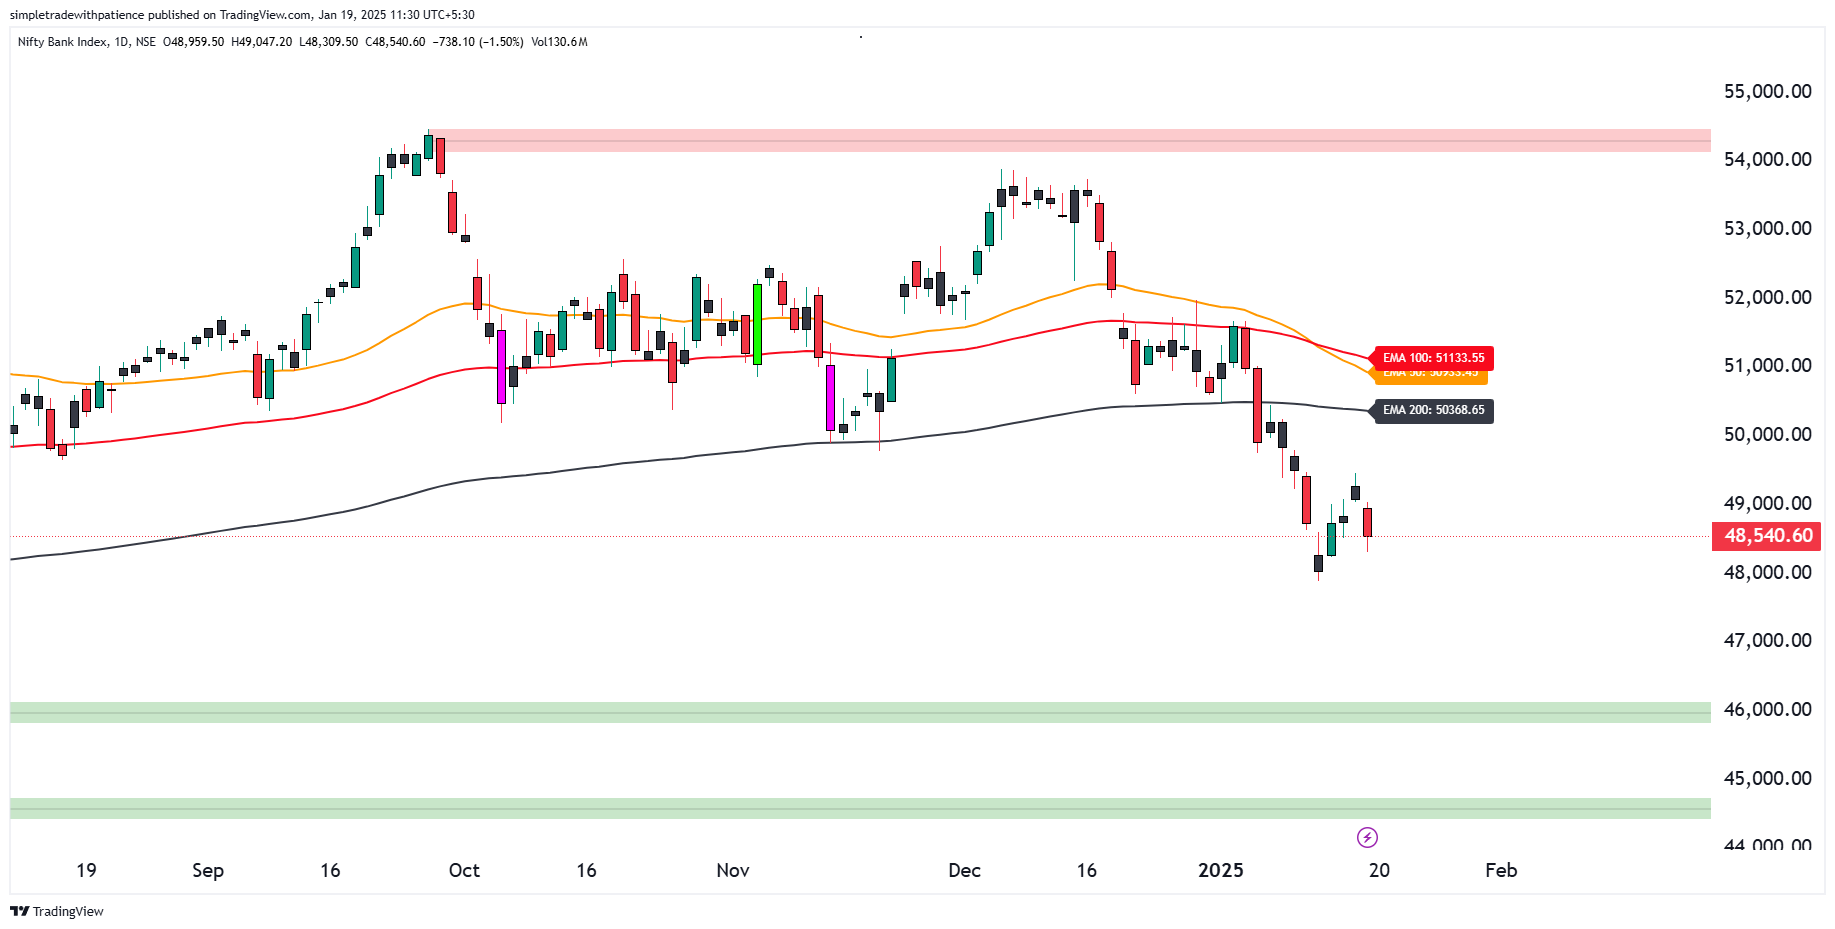
Bank Nifty closed at 48540.6, a notable drop from its previous close of 49278.7. This sharp decline indicates strong selling pressure in the banking sector, with the index slipping further below key moving averages.
EMA Insights
Bank Nifty’s current close of 48540.6 is significantly below its 50-day EMA (50933.47), 100-day EMA (51133.57), and 200-day EMA (50368.39). This alignment of the EMAs above the current price confirms a bearish trend in the medium to long term. Unless there is a strong reversal and a decisive move above these key EMAs, the bearish sentiment is likely to persist, and traders should be cautious of further downside movement.
Key Levels
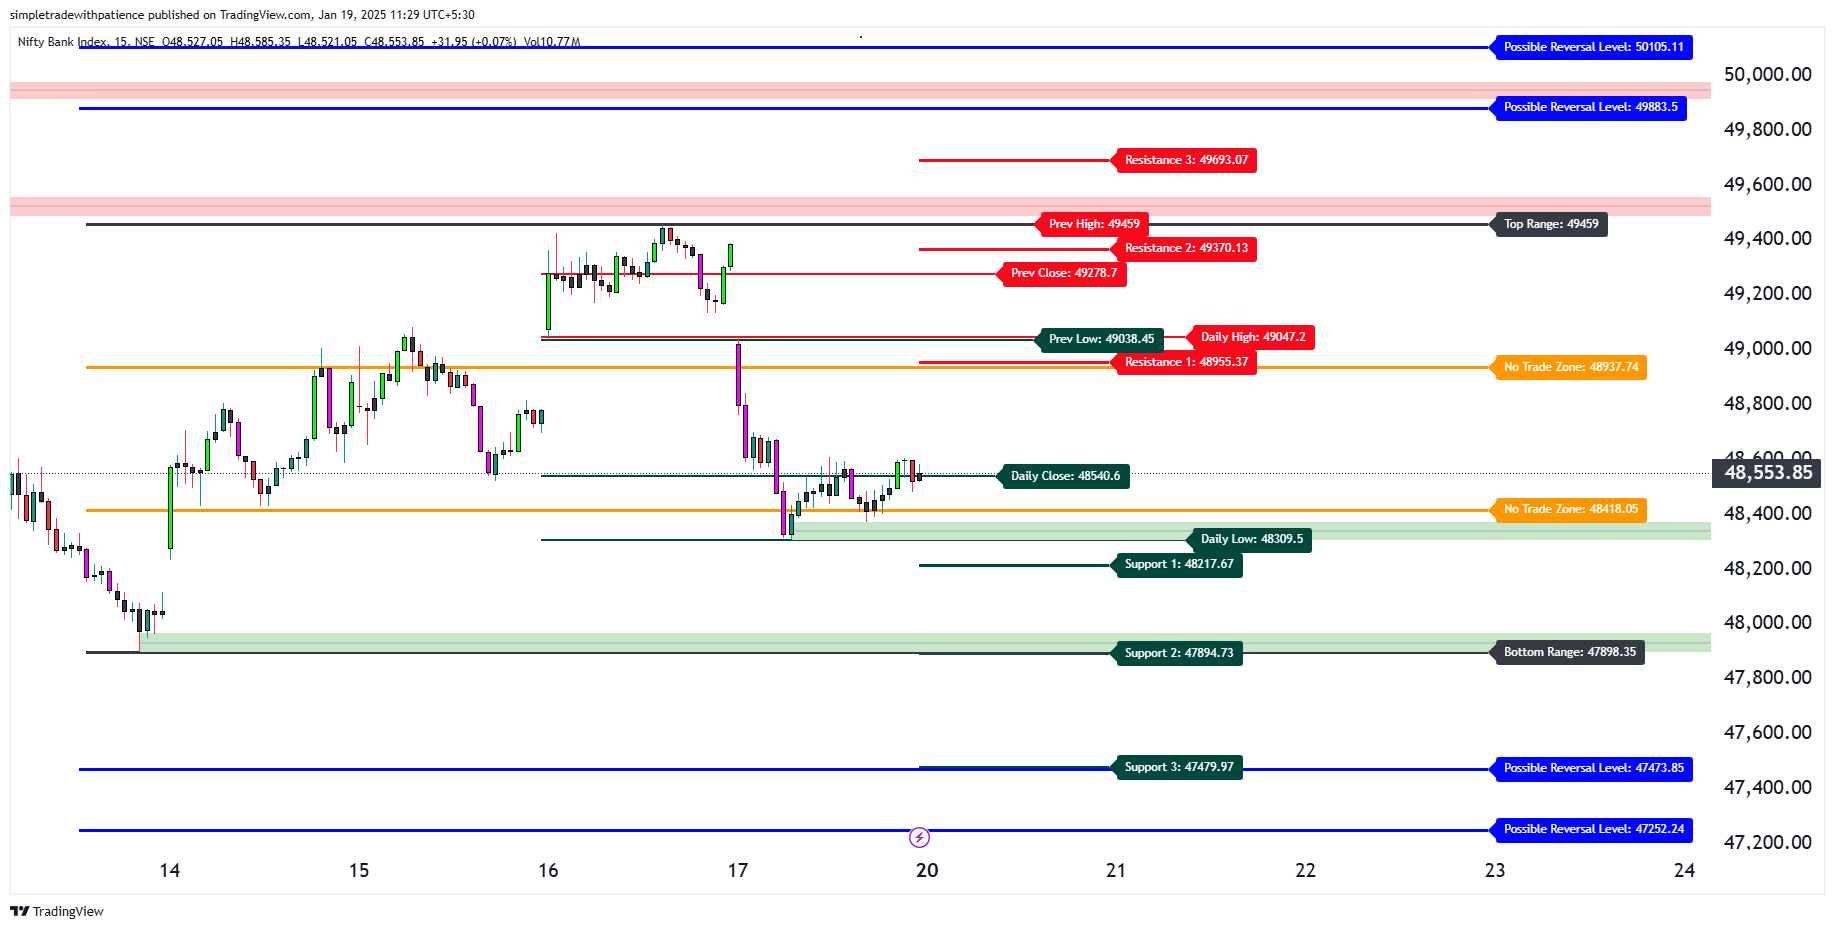
Resistance: Immediate resistance lies at 48955, followed by stronger levels at 49370 and 49693. A breakout above these levels is crucial for any potential short-term recovery. If Bank Nifty manages to move past these resistance points, it could signal a reversal in the bearish trend.
Support: Bank Nifty finds support at 48218, 47895, and 47480. These levels could attract buying interest if the index continues to move lower. A breach of these support zones would indicate further downside potential.
Technical Outlook
Bank Nifty's inability to sustain above key resistances and its position below moving averages suggest that bears remain in control. Intraday traders should watch for price action near support and resistance levels, while positional traders might wait for a decisive trend confirmation.
Finnifty AnalysisOverview
Finnifty closed at 22608.2, marking a significant decline from its previous close of 22943.75. The index has shown sustained weakness, with sellers pushing it lower, breaking key support levels. This indicates bearish sentiment among market participants.

EMA Insights
Finnifty’s current close of 22608.2 is well below the 50-day EMA (23617.8), 100-day EMA (23597.09), and 200-day EMA (23051.26). This positioning below all key moving averages confirms a bearish trend in the medium to long term. The index will need to reclaim these EMAs to suggest any reversal, but as long as the price stays below these levels, the bearish sentiment is likely to persist. Traders should be cautious and watch for any signs of a strong reversal near the moving averages.

Key Levels
Resistance: Immediate resistance is observed at 22792, followed by 22976 and 23113. These levels will act as hurdles for any recovery attempts. A break above these resistance points could signal a shift in the trend, but until then, they remain key zones to watch for selling pressure.
Support: On the downside, Finnifty has support at 22471, 22334, and 22150, where buying interest might emerge if the index continues to slide. If the price breaks these levels, further downside could be expected, with no immediate support until much lower zones.
Technical Outlook
With Finnifty trading below all key moving averages and failing to sustain higher levels, the bearish momentum remains strong. Intraday traders should monitor the support and resistance levels for opportunities, while positional traders might wait for confirmation of a reversal or further breakdown.
Conclusion: Today's market analysis highlights key levels and trends in Nifty, Bank Nifty, and Finnifty, offering valuable insights for traders at all levels. With the market showing clear signs of bearish momentum, it’s crucial to stay alert and focus on the support and resistance zones. Whether you're looking for short-term opportunities or waiting for a confirmation of a reversal, being proactive can make all the difference.
Take Action Now!
Stay ahead of the curve by keeping an eye on these levels and adjusting your strategy accordingly. If you're looking for more insights and expert analysis, make sure to follow STWP for daily updates. Start applying these insights to your trades and sharpen your skills with us. Happy trading!
Disclaimer:
The content provided in this blog is for educational purposes only and does not constitute investment advice, recommendation, or endorsement. Trading in the stock market involves substantial risk, and past performance is not indicative of future results. Always conduct your own research or consult a professional financial advisor before making any investment decisions. The author and the website do not accept any liability for any loss or damage, including but not limited to any loss of profit, which may arise directly or indirectly from the use of this content. All trading strategies mentioned are solely for educational purposes and should not be construed as investment advice.
Register now and never miss an update!
Happy Trading,
────────────────────────────────────
{{DATE}}
 Launch your Graphy