STWP Market Analysis: Nifty & Finnifty - 11.12.2024 Insights

In the world of trading, preparation is half the battle won. Today’s analysis focuses on the Nifty and Finnifty indices, which are consolidating within crucial zones. The price action, trend indicators, and range analysis point to both opportunities and cautionary signals. Let’s break it down, step by step, to help you trade with clarity and confidence.

Tue Dec 10, 2024

Nifty Price Action:
Nifty closed at 24610.05, marking a slight decline from its previous close of 24619, reflecting cautious market sentiment as it continues to test key technical levels. The index has shown resilience by maintaining levels above crucial support zones, indicating underlying optimism among investors.Understanding this price action will be vital for traders focusing on near-term movements.

Resistance Levels to Watch
Nifty is currently navigating a critical technical landscape, with key resistance levels likely to shape the next phase of price movement. Traders should closely monitor the 24688 mark as the immediate hurdle, with a sustained move above this potentially signaling stronger bullish momentum. Beyond this, the next resistance zones to keep an eye on are 24766 - 24855, which have proven strong selling pressure levels in recent sessions. These areas will act as important price barriers, and traders should look for either sustained breakouts or signs of price rejection near these levels to inform strategy decisions.

Support Levels to Watch
Support levels act as key price areas where buying interest is likely to emerge, helping to prevent further declines. For Nifty, the immediate support is observed at 24521, indicating the first strong demand zone. If this level is breached, additional support can be found near 24432 and 24354, areas where historical price action has shown sustained buying pressure. Traders should monitor these levels closely, as a bounce from these points could signal market stabilization and a potential resumption of bullish momentum. A break below these support zones could indicate a shift in trend, so vigilance is essential for positioning.

Trend Analysis Using EMA
The Exponential Moving Averages (EMA) are powerful trend indicators that provide insights into short, medium, and long-term market direction. Currently, Nifty is trading above its 50-day EMA (24413.31), 100-day EMA (24338.65), and 200-day EMA (23638.14), signaling a strong bullish trend. The 50-day EMA acts as a key short-term support, while the 100-day and 200-day EMAs confirm the upward momentum in the medium to long-term horizon. Traders should monitor price movements relative to these EMAs, as maintaining levels above these key averages suggests sustained bullish sentiment.

Range & Zone Analysis
Nifty is currently trading within a dynamic range of 24295.55 to 24857.75, highlighting a period of consolidation with potential for directional moves. The upper range near 25010.67 to 25090.5 suggests areas where price could face strong selling pressure if momentum shifts, while the lower range between 24142.63 and 24062.8 indicates zones where buyers are likely to step in during pullbacks. Additionally, the no-trade zone at 24481.05 to 24666.60 is an area of indecisiveness, where traders should exercise caution unless a clear trend emerges. The demand zone between 24330.1 and 24368.3 offers key support levels for potential bullish reversals, while the supply zone from 24771.9 to 24857.75 could act as a barrier for upward moves. Monitoring these key levels for price reactions can provide insights into market sentiment shifts and potential reversals.

Trading Strategies:
Traders can focus on key support and resistance (S&R) levels to identify potential breakout opportunities. A sustained move above 24688 could signal a bullish continuation toward higher resistance zones, while a breakdown below 24481.05 could shift sentiment bearish. Demand zones like 24330.1 - 24368.3 act as strong support areas, offering opportunities for potential reversals, while supply zones near 24771.9 - 24857.75 represent areas of price rejection. The no-trade zone between 24481.05 - 24666.60 should be approached cautiously, as price movement within this range lacks strong directional bias. Monitoring range breakouts from 24295.55 - 24857.75 and recognizing reversal patterns at 25010.67 - 25090.5 or near critical support zones can guide effective entry strategies and minimize risk exposure.

Finnifty Price Action:
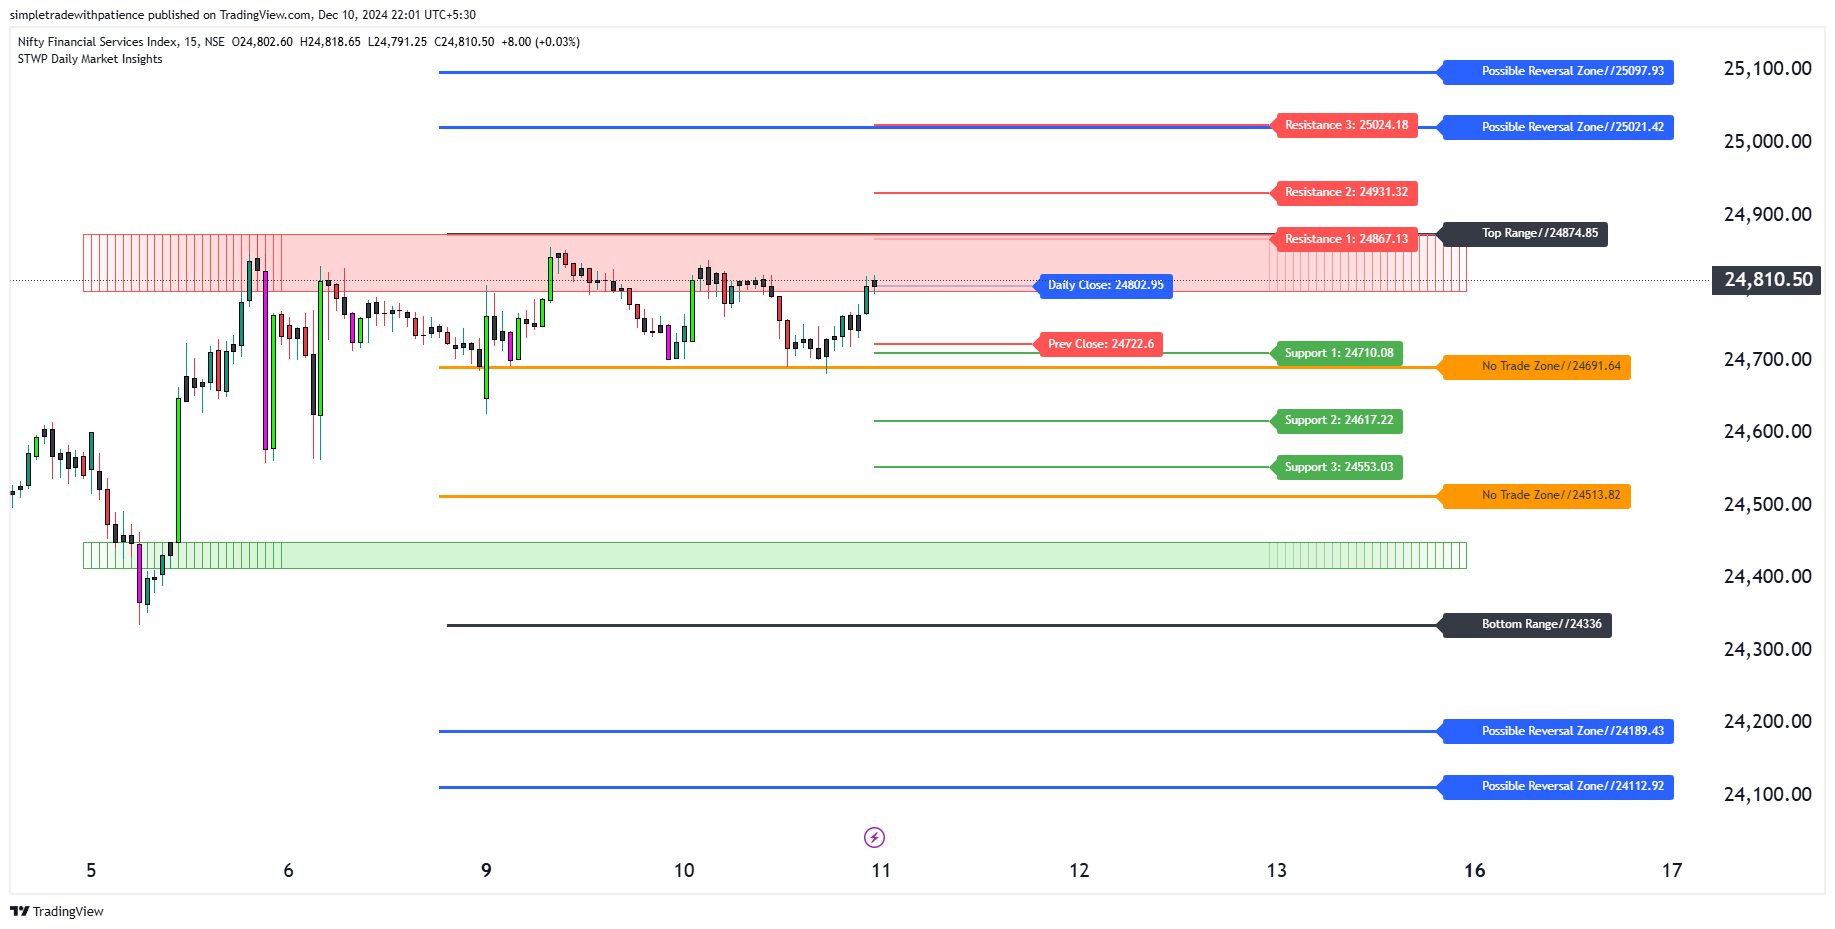
Finnifty closed at 24802.95, marking a notable uptick from its previous close of 24722.6, signaling bullish momentum in the financial sector. This uptick suggests investor confidence driven by optimism in key financial stocks like banking, insurance, and NBFCs. The price action is testing key resistance levels, reflecting a tug-of-war between buyers and sellers. A move above 24867 with sustained volume could further cement the bullish bias, while consolidations within the current range highlight market indecision. Traders are advised to closely monitor these price movements to identify confirmation signals for the next potential trend phase.

Resistance Levels to Watch:
Finnifty is currently hovering near key resistance levels that will determine the next phase of price action. The immediate resistance is 24867, a critical level that has shown strong selling pressure in recent sessions. If this level is breached with solid volume, it could pave the way for further upside momentum. Beyond that, the next resistance zones to monitor are 24931 and 25024, both representing areas of heightened market activity where profit-taking could occur. Traders should keep a close eye on these levels, as a failure to sustain above them could signal a retracement.

Support Levels to Watch:
Finnifty's price action is showing strength, but it's essential to monitor key support levels to gauge market resilience. The immediate support is seen at 24710, which has proven to be a critical demand area. If this level holds, it could act as a strong foundation for a bullish continuation. Below that, 24617 - 24553 represents additional areas where investor confidence could emerge. These levels highlight where buying activity is likely to increase, offering opportunities for trend continuation or reversals. Keeping a close eye on these support zones can help traders identify favorable entries during pullbacks or periods of market hesitation.

Trend Analysis Using EMA:
Finnifty's trend remains firmly bullish, as evidenced by the positioning of key Exponential Moving Averages (EMAs). The 50-day EMA stands at 23976.11, acting as strong short-term support and indicating sustained positive momentum. The 100-day EMA at 23644.55 confirms the medium-term uptrend, while the 200-day EMA, currently at 22887.01, provides a strong foundation in the long-term bullish trajectory. The consistent trading above all these key EMAs suggests investor confidence and a continuation of upward trends, making the financials sector a strong market driver.

Range & Zone Analysis:
Finnifty is currently trading within a well-defined range of 24336 to 24874.85, reflecting a balanced market sentiment with buyers and sellers actively contesting key technical levels. The upper zone between 25021 and 25097.93 represents areas where selling pressure could emerge, while the lower range near 24189 to 24112.92 suggests potential zones of support. Additionally, a no-trade zone has formed between 24513.82 and 24691.64, which traders should monitor closely for any signs of price consolidation or shifts. Watching price behavior near established supply and demand levels can provide insights into potential trend reversals, offering opportunities for strategic entries and exits.

Trading Strategies:
Traders can focus on breakout opportunities by monitoring key support and resistance levels. A move above 24867 with strong volume could suggest the continuation of the uptrend, while a breakdown below 24513.82 could signal bearish pressure. Demand zones like 24412.15 - 24450.35 are potential areas for a positive price reaction if tested, while supply zones near 24795 - 24874.85 may act as resistance. The no-trade zone between 24513.82 - 24691.64 should be approached with caution unless clear signals emerge, as price movements here are typically uncertain. Watching reversal areas like 25021.42 - 25097.93 or the bottom range at 24189.43 - 24112.92 could provide insights into trend changes. Traders should also monitor the Finnifty range between 24336 - 24874.85 for signs of range breakouts or breakdowns as they set the tone for directional momentum.

🔮 Watch Our Exclusive BankNifty Analysis for 11.12.2024!
Want deeper insights into how the Banking sector is performing?
Dive into our detailed analysis of BankNifty with technical trends, key support/resistance levels, and market sentiment for December 11th.
🎥 Watch the Full Video Here
Don't miss this analysis if you're a trader focused on the financials sector.

Conclusion: 
Nifty and Finnifty are currently navigating crucial technical levels, with bullish undertones suggesting investor optimism. As Nifty tests resistance zones and Finnifty shows strength within its uptrend, traders should maintain focus on key support, resistance, and EMA trends to identify actionable signals. Employing strategies like breakout confirmations, demand zone reversals, and trend support analysis can provide an edge in this market environment. With volatility likely around key levels, disciplined execution and proper risk management will be essential for leveraging opportunities. Stay informed, stay prepared, and trade smart.
Want to stay ahead in the market with timely insights and actionable strategies? 📊✨
Join STWP for daily market analysis, expert trading strategies, and trend updates delivered straight to you. Whether you're a trader or investor, we simplify market moves to help you make informed decisions.
👉 Subscribe Now and Unlock Your Trading Edge! 🚀
Stay informed. Stay prepared. Let’s make the market work for you! 💡

Disclaimer:
The information and analysis provided in this blog are for educational and informational purposes only and should not be considered as financial, investment, or trading advice. Market conditions are subject to change, and past performance does not guarantee future results. Readers are advised to conduct their own research, consult with a qualified financial advisor, and carefully assess their risk tolerance before making any trading or investment decisions. STWP or its affiliates do not accept any responsibility for any financial losses incurred based on the analysis or information shared herein.

🚀 Unlock Market Secrets Today!📢
Dive into the STWP Stock Technical Analysis for 360ONE, CYIENT, and LTIM – your ultimate daily market digest. Discover bullish trends, breakout opportunities, and actionable insights backed by professional analysis.🌟 Why Read This?

  • Expert technical breakdowns
  • Key support & resistance levels
  • Insights into swing trading strategies
  • Stay ahead with the latest market trends
📈 Don't miss out on opportunities shaping tomorrow's market!
👉 Read Now
🔎 STWP – Simple Trade with Patience. Simplify your trading journey today!
#StockAnalysis #MarketInsights #TradingStrategies #BreakoutStocks