STWP Options Research Desk: Detailed Data Interpretation Across Major Strikes
💹 Adani Enterprises Ltd (NSE: ADANIENT)
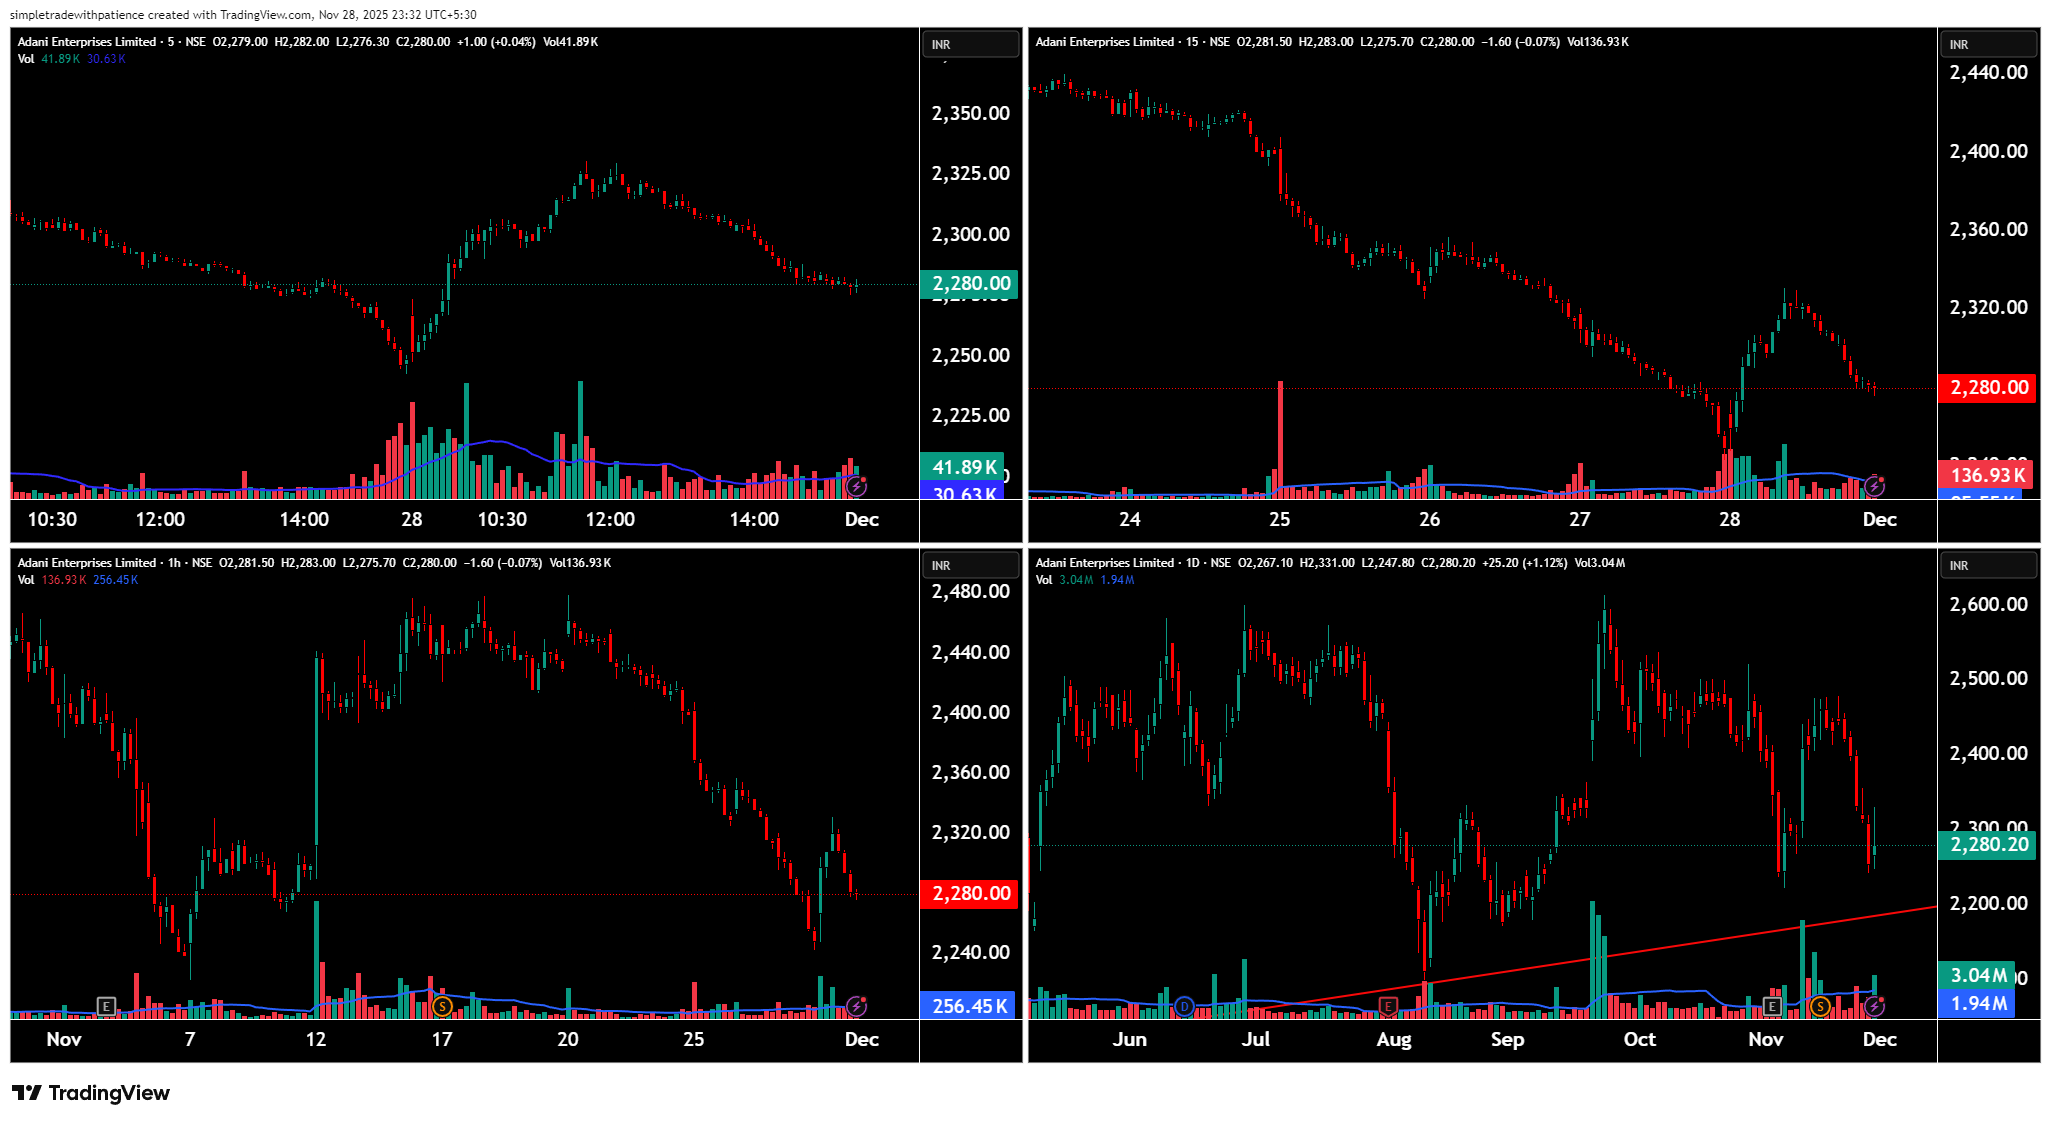
Sector: Conglomerate | CMP: 2280.00 | View: Range Support Retest near 2280
ADANIENT spent the day moving weakly, and the price behaviour was fairly simple to understand. The stock opened soft, tried to move up for a short while, but sellers stepped in around 2320–2340 and pushed it back down. After that, the price slowly fell and ended close to 2280 again. This shows that sellers were stronger throughout the day. The volumes also increased on the down-moves, which means the selling was genuine, not panic. On bigger charts, the stock has been moving inside a wide range between 2240 at the bottom and 2600 at the top. Every time it tries to go up near 2320–2360 or even higher toward 2540–2600, it gets rejected. Since it is now close to the lower part of this range again, the stock is still sideways — not in a strong uptrend. For a beginner, the simple takeaway is: sellers are active above 2320, buyers support the stock near 2240–2280, and until one side breaks these levels, the stock will continue to move inside this range.
Today’s option activity shows that traders were expecting ADANIENT to stay within a range rather than make a big breakout. Call options (especially the 2300 CE) saw buying earlier in the day, which usually signals that some traders were hoping for an upward move if the stock stayed above support. However, not all call strikes were useful — some were too deep in the money or too far out of the money, making them less effective for quick intraday moves.
On the put side, a lot of traders were selling puts at 2280 and 2300. When traders sell puts, it usually means they believe the stock will stay above those levels. This also keeps put premiums lower, because sellers expect stability rather than a big fall. Since the price stayed near support, the put sellers had the advantage — they earned from slow premium decay.
Volatility (IV) remained moderate, meaning the market wasn’t expecting a huge jump or crash. The overall setup shows a tug-of-war: call buyers are holding on for a bounce, while put sellers are confident that 2280–2300 will act as a support zone.
In simple terms:
• If ADANIENT stays above 2280, call options may gain.
• If ADANIENT breaks below 2280, the fall may continue — but usually only after a retest confirms the breakdown.
This structure fits a typical range-bound market where both sides are active but support levels still matter.
For next session, the most important level on the chart is 2280. If the stock stays above this area, it can bounce toward 2320–2340. If it slips below 2280 and fails to get back above it, the next support lies around 2240–2250. For a bounce setup, the cleaner option is the 2300 CE — only take it if the stock holds 2280 and then climbs back above 2292–2295 on a 5 or 15-minute chart. Exit if the option premium drops around 20–25% or if the stock closes below 2275. For a breakdown setup, the safer choice is the 2260 PE, but only after the stock breaks 2280, retests it from below, and stays under 2275. Exit if the premium falls about 25–30% or if the spot goes back above 2285.
Avoid trading in the tight 2280–2298 band — price gets choppy there and option premiums decay quickly. Keep your position sizes reasonable and use strict stop-losses based on option premium, not just spot price. Watch how open interest and volumes behave — sudden changes often reveal the next move early. Overall, 2280–2300 is the fight zone. Holding it means a possible bounce; losing it opens the door to a deeper dip. Monday may be volatile in the first hour, so follow levels, watch volume, and react only after confirmation.
💹 Adani Ports & SEZ Ltd (NSE: ADANIPORTS)
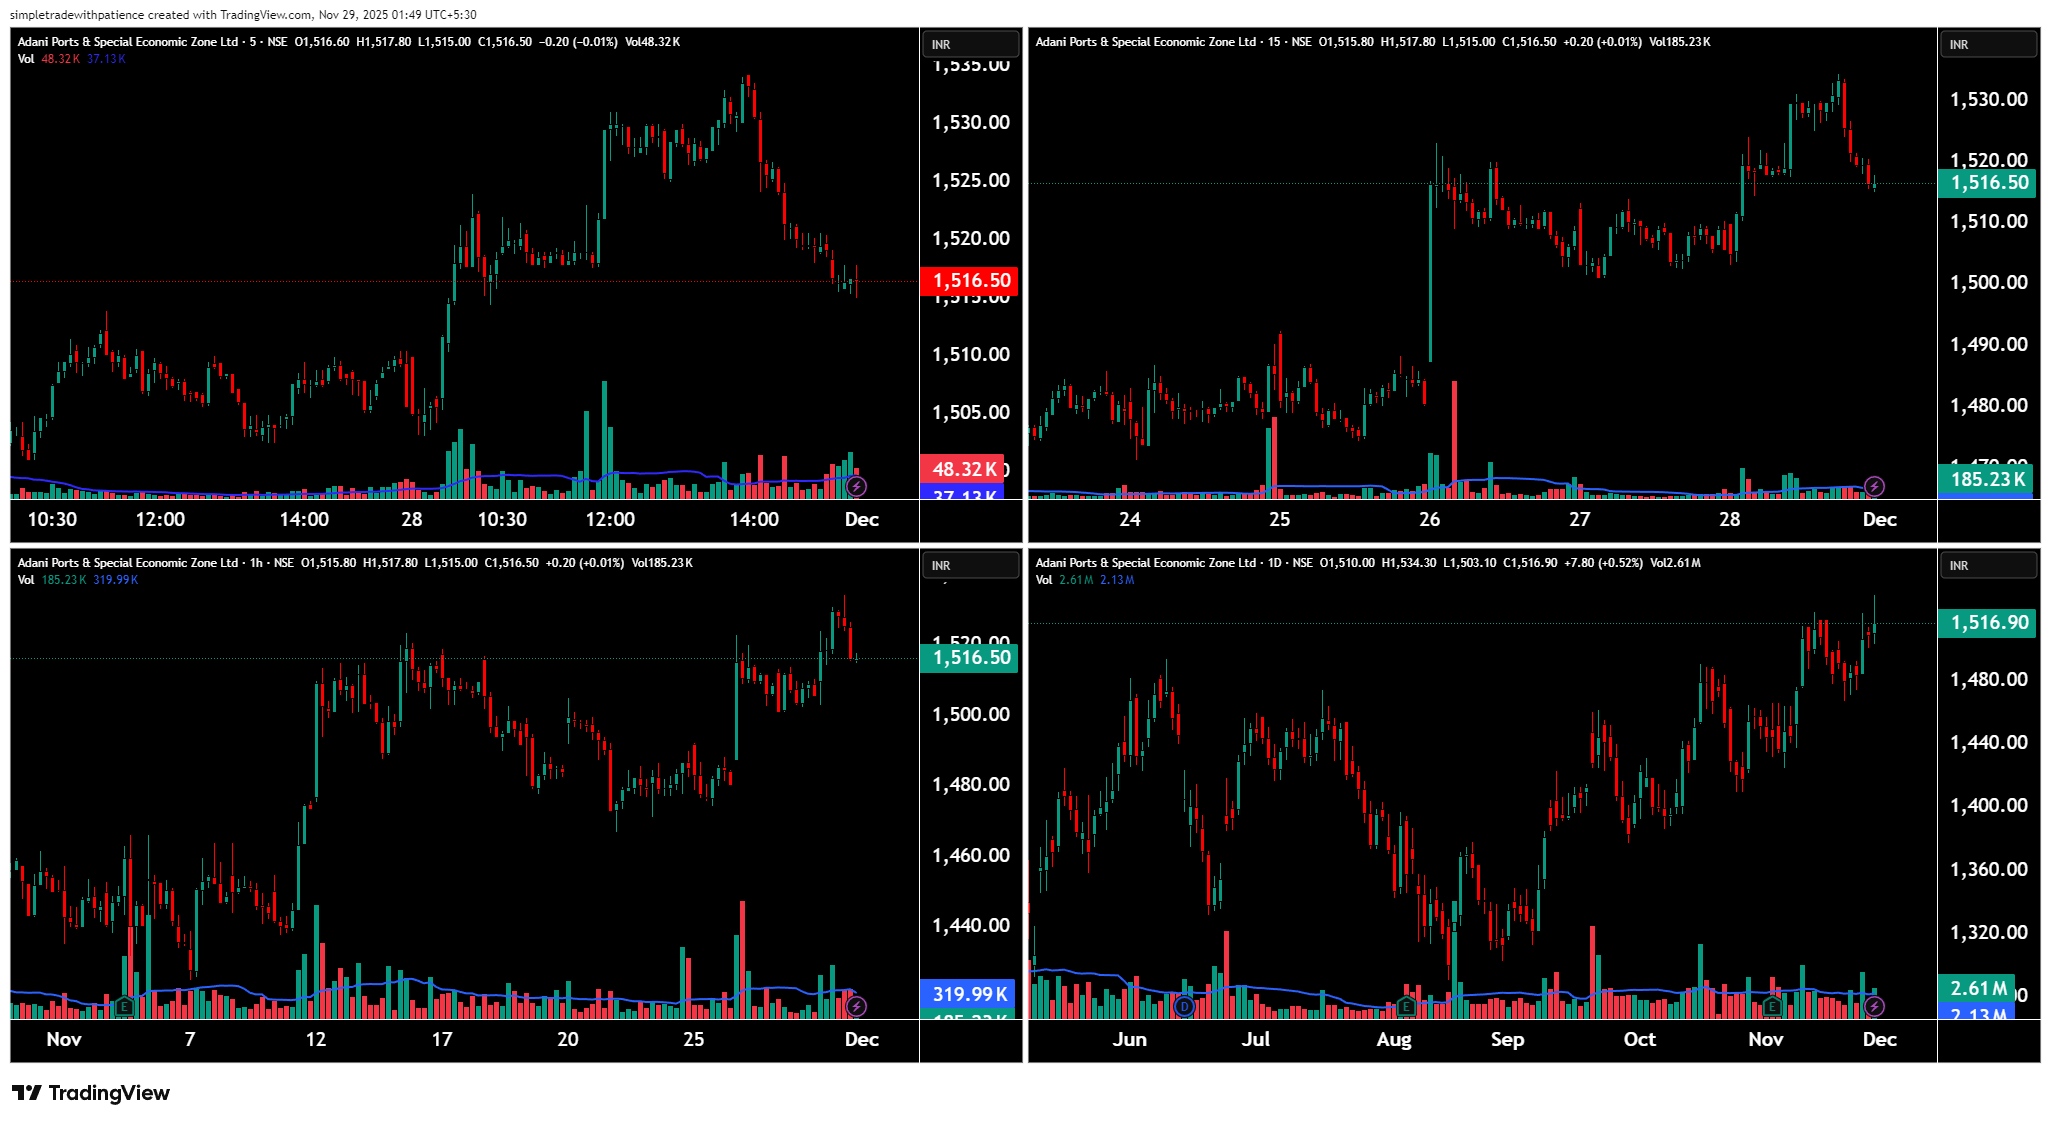
Sector: Logistics & Ports | CMP: 1516.50 | View: Bullish momentum holding above 1500 support
Adani Ports moved with steady, controlled strength through the session. The stock opened firm, made a brief attempt toward 1530, and met mild selling around that zone. Even with this pushback, buyers consistently stepped in on dips, helping the price maintain stability above 1510. Volume activity supported the upside — the green candles carried stronger participation than the red ones, which signals that buying interest was more dominant than the intraday selling.
On broader timeframes, the stock has been forming a clean series of higher lows, showing that demand continues to build on every retracement. The larger range sits between 1480 on the downside and 1560 on the upside. Every time price slips toward 1480–1500, buyers emerge strongly, while the region between 1530–1560 has been a profit-booking zone. With the stock now trading in the upper half of the range, the broader bias stays positive. For newer traders, the idea is simple: support exists around 1500–1510, resistance appears near 1530–1560, and until the stock breaks either zone decisively, it will continue travelling within this rising channel.
Option activity today reflected the same constructive tone. Strong long build-ups were seen in key call strikes like 1540 CE, 1560 CE, and 1580 CE — showing that positional traders are preparing for continuation. These strikes had healthy deltas, giving enough sensitivity to capture an upside extension if price moves.
On the put side, most activity pointed toward stability rather than aggression — 1500 PE and 1520 PE showed short build-ups or unwinding, which is typical when participants do not expect a large fall. Implied volatility stayed around the 20–21 zone, which is neither too high nor too low, indicating a steady environment where premium decay and directional moves stay balanced. Altogether, the option chain leans bullish with supportive cues on both sides.
In simple terms:
• Staying above 1510 keeps call options favourable.
• Dips into 1505–1510 are usually bought.
• A clean break below 1500 only matters if the retest also fails — that opens room toward 1480.
For the next session, 1510 remains the key reference point. If the stock trades above this level with strength, it has the potential to move toward 1525–1540. If it slips below 1510 and struggles to reclaim it, the next support zone lies around 1500–1502. For continuation trades, the cleaner call strikes are 1540 CE or 1560 CE, but they should be taken only if price holds above 1510 and then pushes past 1520 with a clear candle close. Exit the option if the premium falls by roughly 20–25% or if the stock closes below the intraday support.
Avoid trading inside the tight 1508–1520 pocket — price often becomes choppy there and premium decay is quick. Stick to defined levels, size positions thoughtfully, and rely on volume confirmation before acting. As long as 1500–1510 holds, the bullish structure remains healthy; losing this zone shifts the focus back to the 1480 base. Follow levels, monitor OI shifts, and wait for cleaner candles before entering.
💹 Hero Motocorp Ltd (NSE: HEROMOTOCO)
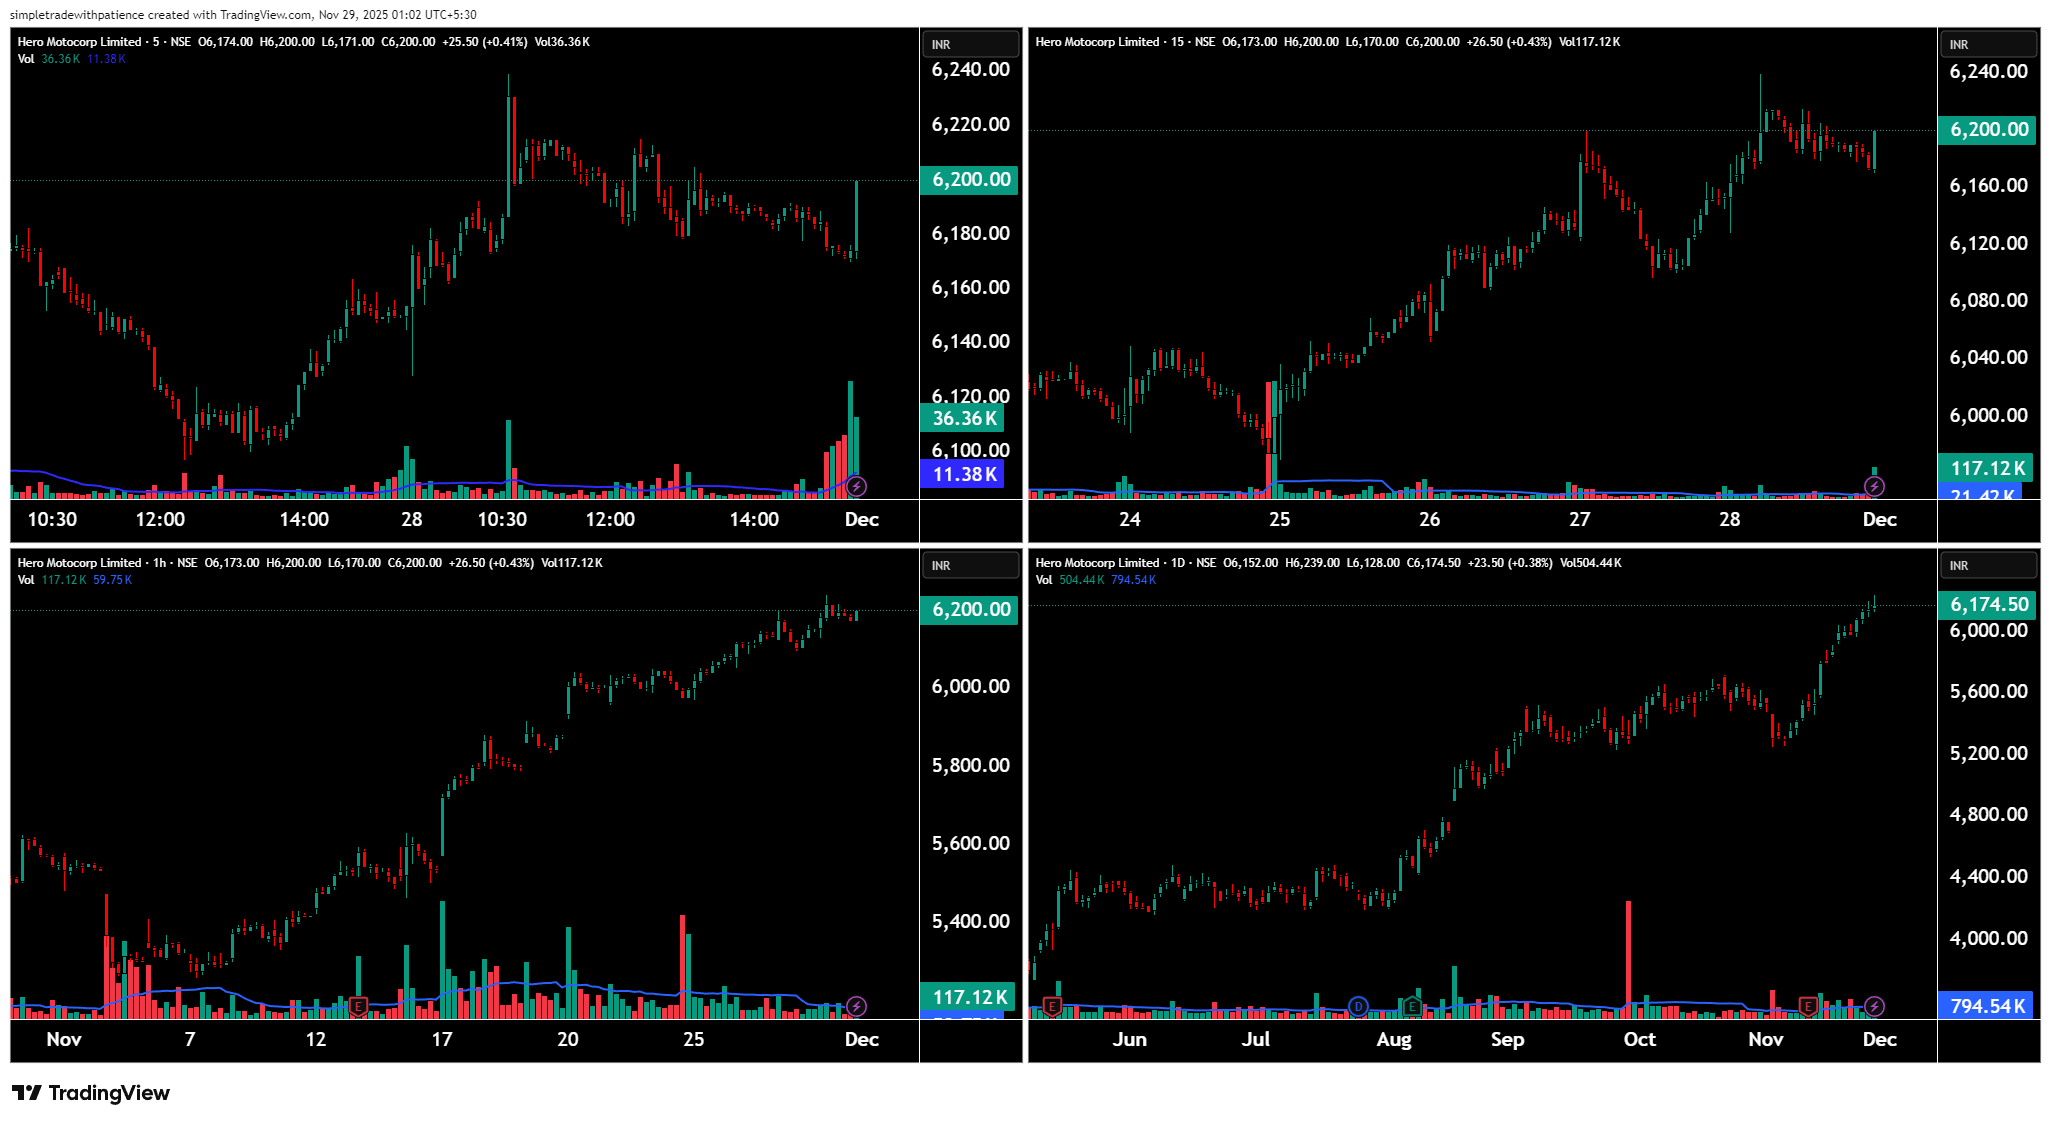
Sector: Two-Wheelers | CMP: 6200.00 | View: Strong Uptrend — Momentum Holding Near Highs
Hero Motocorp traded with a steady bullish tone throughout the session. The stock opened firm, attempted a push beyond 6220, and met mild intraday selling around the upper levels. Each dip was absorbed quickly, and price held comfortably above 6150, signalling that buyers were active and defending every minor pullback. Volume patterns were supportive — green candles carried stronger participation, indicating controlled accumulation rather than speculative buying.
On the broader charts, the stock has been in a powerful uptrend, steadily forming higher highs and higher lows for several weeks. The key swing structure remains intact: every retracement into the 6000–6080 zone has been met with immediate demand, and the recent breakout above 6100 has continued to sustain without weakness. The next major resistance sits near 6300–6350, while strong demand remains anchored around 6000. For new traders, the takeaway is clear: buyers dominate above 6100, sellers appear only closer to 6300, and the trend remains sharply upward unless the stock slips below 6000 on a confirmed retest.
Today's option activity strengthened this bullish narrative. Heavy long build-ups were seen in core call strikes like 6300 CE and 6500 CE — a sign that traders expect the uptrend to continue. These strikes carried healthy deltas in the 0.25–0.43 range, which means the options respond well to directional moves and offer clean payoff potential in a trending market.
On the put side, most strikes — especially 6000 PE and 6100 PE — showed short build-up or long unwinding. This is typical when market participants believe declines will be shallow. IV stayed around 21–22, which is moderate and favourable for directional options. Overall, the option chain clearly leaned bullish, with call buyers positioned for continuation and put sellers comfortable taking premium on the downside.
In simple terms:
• Holding above 6150–6170 favours call buyers.
• Dips into 6100–6120 are likely to be bought aggressively.
• A breakdown matters only if 6000 is lost and retested unsuccessfully.
For the next session, 6150 is the key level to track. If the stock sustains above it, price can attempt 6240–6300. Failure to hold 6150 may drag the stock toward 6100, where strong support is expected. For continuation trades, the cleaner call options are 6300 CE or 6500 CE, but only if price maintains above 6150 and crosses 6200 with strength on a 5- or 15-minute close. Exit if the option premium drops about 20–25% or if the stock slips below the session support.
Avoid trading in the tight 6170–6205 congestion band — price tends to chop here and option premiums decay quickly. Stick to the main levels, keep position sizes controlled, and wait for decisive candles with volume. As long as 6100–6150 holds, Hero Motocorp remains in a strong uptrend with momentum favouring the bulls; losing this area shifts focus back to the deeper supports near 6000. Watch open interest, follow price relative to support zones, and let clarity drive entries.
💹 Bajaj Auto Ltd (NSE: BAJAJ-AUTO)
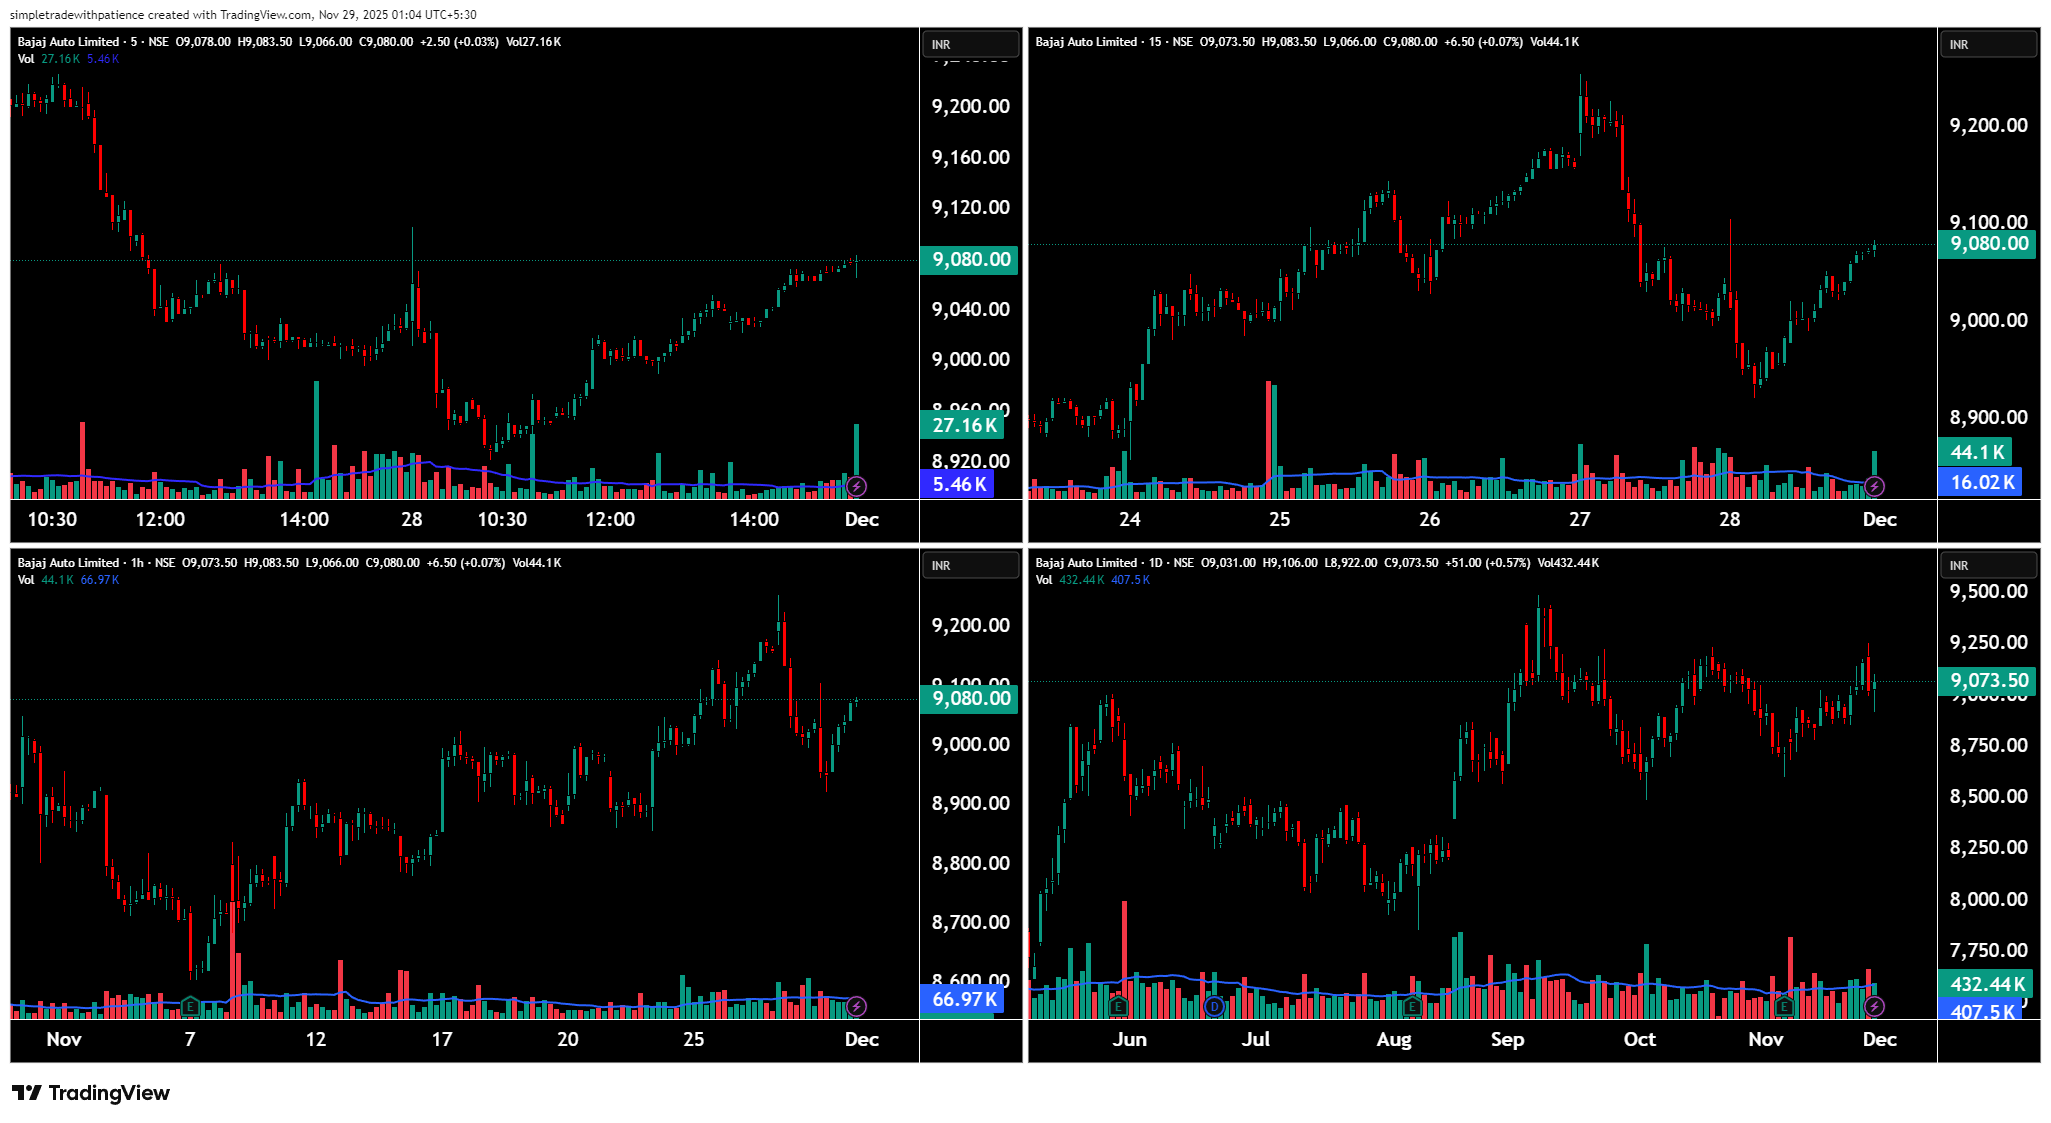
Sector: Automobiles – Two-Wheelers | CMP: 9080.00 | View: Bullish Continuation — Dips Bought, Trend Intact
Bajaj Auto traded with a controlled upward bias throughout the session. The stock opened steady, slipped slightly in early trade, but recovered quickly as buyers stepped in around 9020–9040. From there, price climbed back toward 9080, signalling that demand was active on every small decline. Volume behaved in a healthy manner — green bars carried more weight than reds, suggesting quiet accumulation rather than reactive selling.
On the higher timeframes, the stock continues to build a strong rising structure. The broader range sits between 8900 at the base and 9250–9300 at the upper band. Every pullback toward 8900–8950 has been greeted with aggressive buying, and the recent recovery from last week’s correction shows trend strength is still intact. Price is forming higher lows and remains well above major supports. For beginners, the structure is straightforward: buyers dominate above 8950, sellers appear only nearer to 9200–9300, and the trend remains upward unless price breaks below the lower support on confirmation.
Option flow today supported this bullish stance. Strong long build-ups came through in the 9000 CE, 9100 CE, 9200 CE and 9300 CE strikes — exactly the kind of positioning that indicates expectation of continuation. Deltas in the 0.32–0.53 region provide good directional sensitivity without excessive volatility.
On the put side, many strikes like 8900 PE and 9000 PE showed short build-up, signalling that participants do not expect a meaningful downturn. IV held in the 18–20 zone, keeping premiums fairly stable while still allowing directional moves to reward call buyers. Overall, the option data leans clearly bullish: call buyers are positioned for upside, and put writers are confident that the stock will remain protected above major supports.
In simple terms:
• Holding above 9040–9060 keeps call options favourable.
• Dips into 8980–9020 are likely to attract buyers again.
• A deeper correction only opens below 8950 after a clean breakdown–retest.
For the next session, 9040 is the most important level to track. Sustaining above it can open the path toward 9120–9180 initially, and then 9250 if momentum strengthens. If the stock fails to stay above 9040, expect a dip toward 8980–9000, where demand may reappear. For continuation trades, the cleaner call options are 9200 CE, 9300 CE or 9400 CE, but only if the stock holds above 9040 and then closes above 9080–9090 on a 5- or 15-minute chart. Exit the option if premiums fall around 20–25% or if the stock closes below session support.
Avoid trading inside 9040–9090, as price tends to get choppy there and option premiums decay faster. Stick to the stronger zones, track volume confirmation, and stay disciplined with stop-loss rules. As long as 8980–9040 holds, Bajaj Auto remains firmly bullish; losing this range only shifts focus to deeper supports near 8900. Watch open interest behaviour carefully — it often signals the next directional move early.
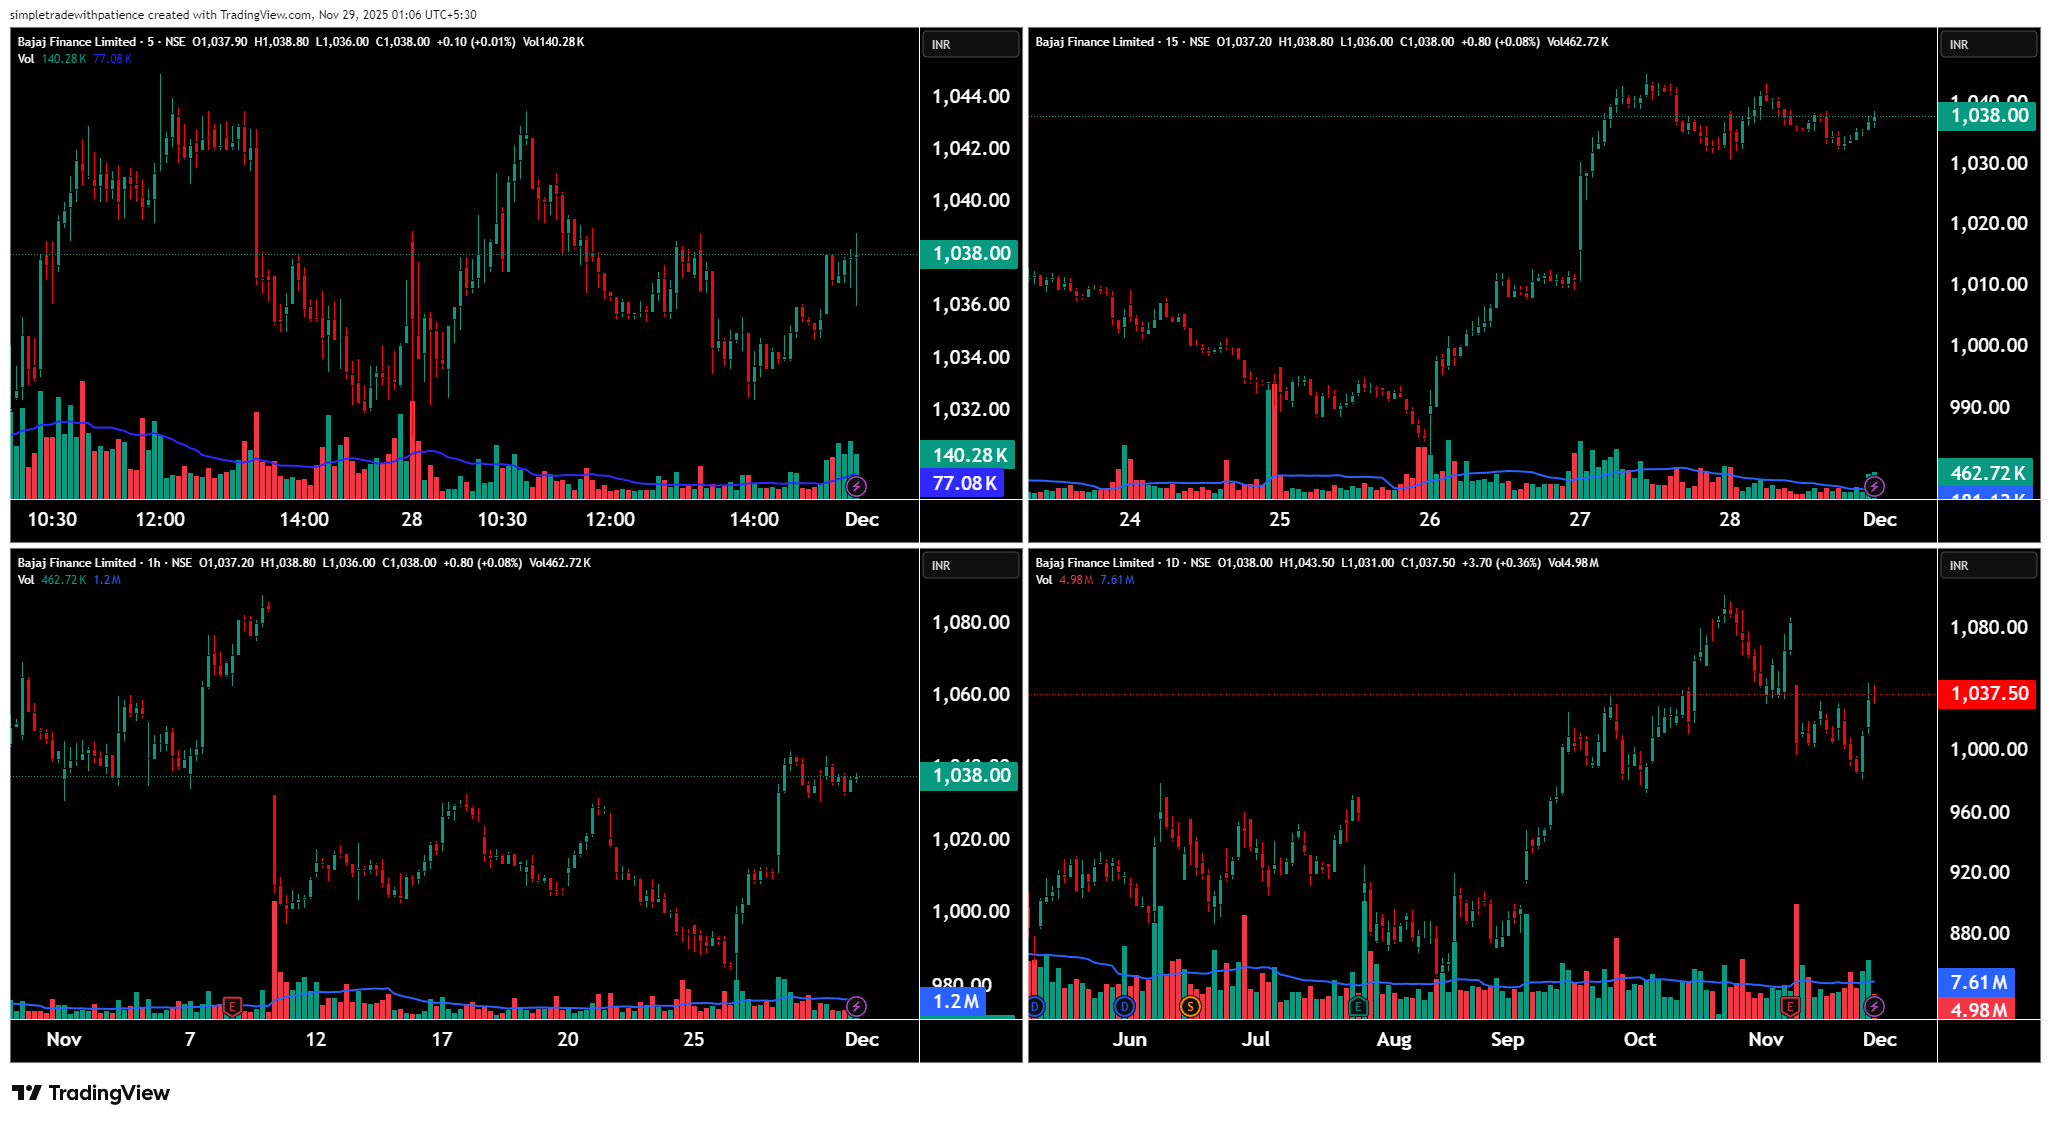
💹 Bajaj Finance Ltd (NSE: BAJFINANCE)
Sector: NBFC – Consumer Lending | CMP: 1038.00 | View: Early Bullish Reversal Attempt — Buyers Returning Near Base
Bajaj Finance traded in a controlled manner throughout the session. The stock opened around 1037–1038, dipped slightly toward 1036, but recovered quickly as buyers stepped in near the lower intraday zone. Much of the price action stayed inside a narrow band, signalling patience and quiet accumulation rather than aggressive selling. Volume behaviour was supportive — green candles carried respectable participation, showing that buyers were defending levels instead of allowing deeper declines.
On the higher timeframes, the stock appears to be stabilising after a corrective phase. The broader structure has a strong base between 1000–1020, where the stock has repeatedly found support in recent weeks. Every push toward 1045–1060 has faced mild resistance, but the chart now shows early signs of a bullish reversal: higher lows are beginning to form, and the stock is holding above its short-term moving averages on the hourly chart. For newer traders, the message is simple: below 1020 the stock weakens, above 1030–1035 buyers regain control, and a strong breakout only occurs once the price crosses 1045–1050 with conviction.
The option chain supported this improving bullish sentiment. Clean long build-ups were seen in key calls such as 1040 CE, 1050 CE and 1060 CE — a healthy sign that traders are positioning for a potential short-term upside extension. These strikes had deltas in the 0.41–0.54 zone, offering good balance between risk and responsiveness.
Short covering was active in some deeper strikes like 1020 CE and 1030 CE, showing that previous shorts are beginning to exit as price stabilises. On the put side, activity was light — 960 PE remained mostly neutral, while 1000 PE showed signs of long unwinding, indicating that put buyers are backing off and expecting stability. IV around the 19–20 mark kept the environment comfortable for directional trades. Altogether, the option chain hinted at a steady, controlled bullish build-up.
In simple terms:
• Holding above 1030–1035 keeps call options attractive.
• Dips into 1020–1030 may get bought again.
• Only a close below 1020 weakens the structure and exposes the lower base at 1000.
For the next session, 1035 is the critical level to watch. If the stock sustains above it with strength, it can aim toward 1045–1055, and eventually attempt 1060. Failure to hold 1035 can drag it toward 1025–1030, where buyers might still attempt to defend. For directional trades, the cleanest choices are 1040 CE or 1050 CE, but only if the stock stays above 1035 and pushes above 1040 with a decisive candle on the 5- or 15-minute timeframe. Exit the option if the premium drops by about 20–25% or if the spot closes below the session’s support zone.
Avoid trading inside the 1030–1040 congestion band — price gets tight here and premiums decay quickly. Focus on clean breaks, clear candles, and volume-backed moves. As long as 1020–1035 holds, the early reversal structure remains valid; losing this region shifts the focus back to the lower base near 1000. Monitor OI shifts carefully, as sudden changes often reveal breakout or rejection zones early.
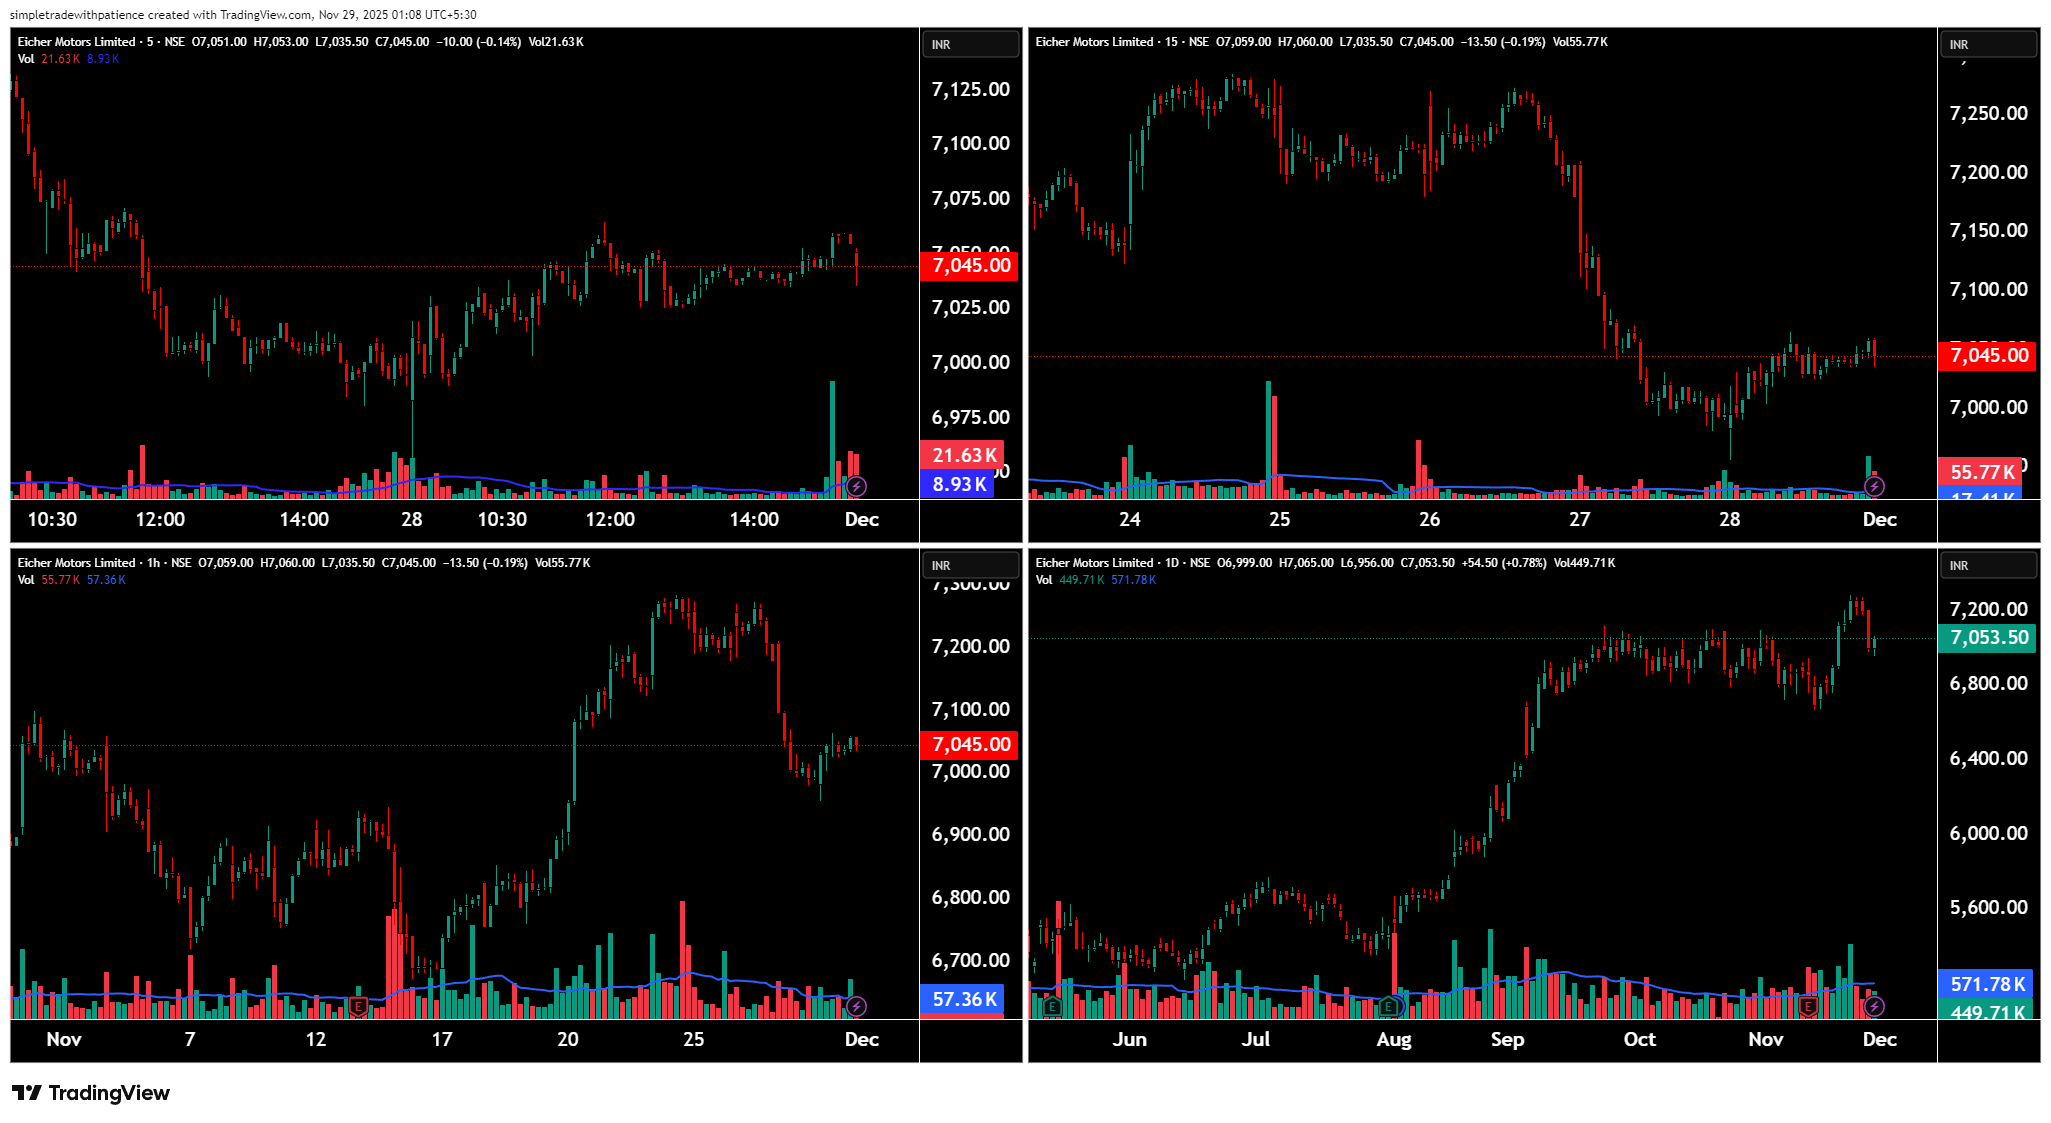
💹 Eicher Motors Ltd (NSE: EICHERMOT)
Sector: Automobiles – Premium Two-Wheelers | CMP: 7045.00 | View: Bullish Structure — Support Holding, Trend Intact
Eicher Motors traded in a muted but stable manner during the session. The stock opened slightly soft, drifted toward 7020–7030, and recovered modestly as buyers stepped in around the lower intraday zones. Most of the price action stayed within a tight band, showing controlled consolidation rather than weakness. The small bursts of volume on green candles indicated selective accumulation, while the red candles carried relatively lower participation.
On broader timeframes, the stock remains inside a healthy uptrend. After rallying strongly in recent weeks, the price faced a mild pullback from the 7200 zone — a normal reaction after an extended run. The structure now shows early signs of stabilisation: price is respecting the 7000 level well, hourly charts are flattening out, and sellers have not been able to push it below the key swing region. For beginners, the structure is simple to understand: buyers defend 7000–7020 consistently, sellers appear only near 7150–7200, and until either level breaks with confirmation, the stock continues to trade inside this bullish consolidation.
Option activity today aligned with this view. Strong long build-ups appeared in the 7000 CE and 7100 CE strikes, suggesting that traders are positioning for a potential continuation move as long as support holds. These strikes had deltas around 0.50–0.61 — ideal for directional trades with good sensitivity.
On the slightly higher strikes, short covering was visible in 7200 CE, 7250 CE, and 7300 CE — a positive sign, indicating that earlier short positions are being unwound as the stock refuses to break down. On the put side, long unwinding was seen in deeper strikes such as 7000 PE and 6800 PE, meaning bearish sentiment is fading. IV remained steady around the 18–19 range, which creates a balanced environment for option buyers without heavy premium risk. Overall, option data signalled early-strength rebuilding around key supports.
In simple terms:
• Holding above 7020–7030 keeps the stock stable and supports call options.
• Dips into 6980–7000 can attract buyers again.
• A strong upside move only triggers after crossing 7080–7100 with volume.
For the next session, 7030 is the key level to track. If the stock sustains above this zone, it can attempt 7080–7120, and potentially push toward 7180 if momentum strengthens. If it slips below 7030, price may revisit 6990–7000 where buyers could try to defend again. For directional trades, the cleaner strike selections are 7100 CE or 7000 CE, but only if the stock holds above 7030 and breaks through 7080–7090 on a strong candle. Exit if the premium drops by 20–25% or if the stock closes below the intraday support level.
Avoid trading inside the 7020–7055 tight band — this zone often behaves choppy, causing quick premium decay. Stick to the cleaner breakout and support zones with volume confirmation. As long as 7000–7030 holds, the broader uptrend stays intact; losing this region brings the stock into a deeper retracement toward 6900. Keep an eye on OI behaviour — sudden changes in CE or PE positions often signal the next decisive move.
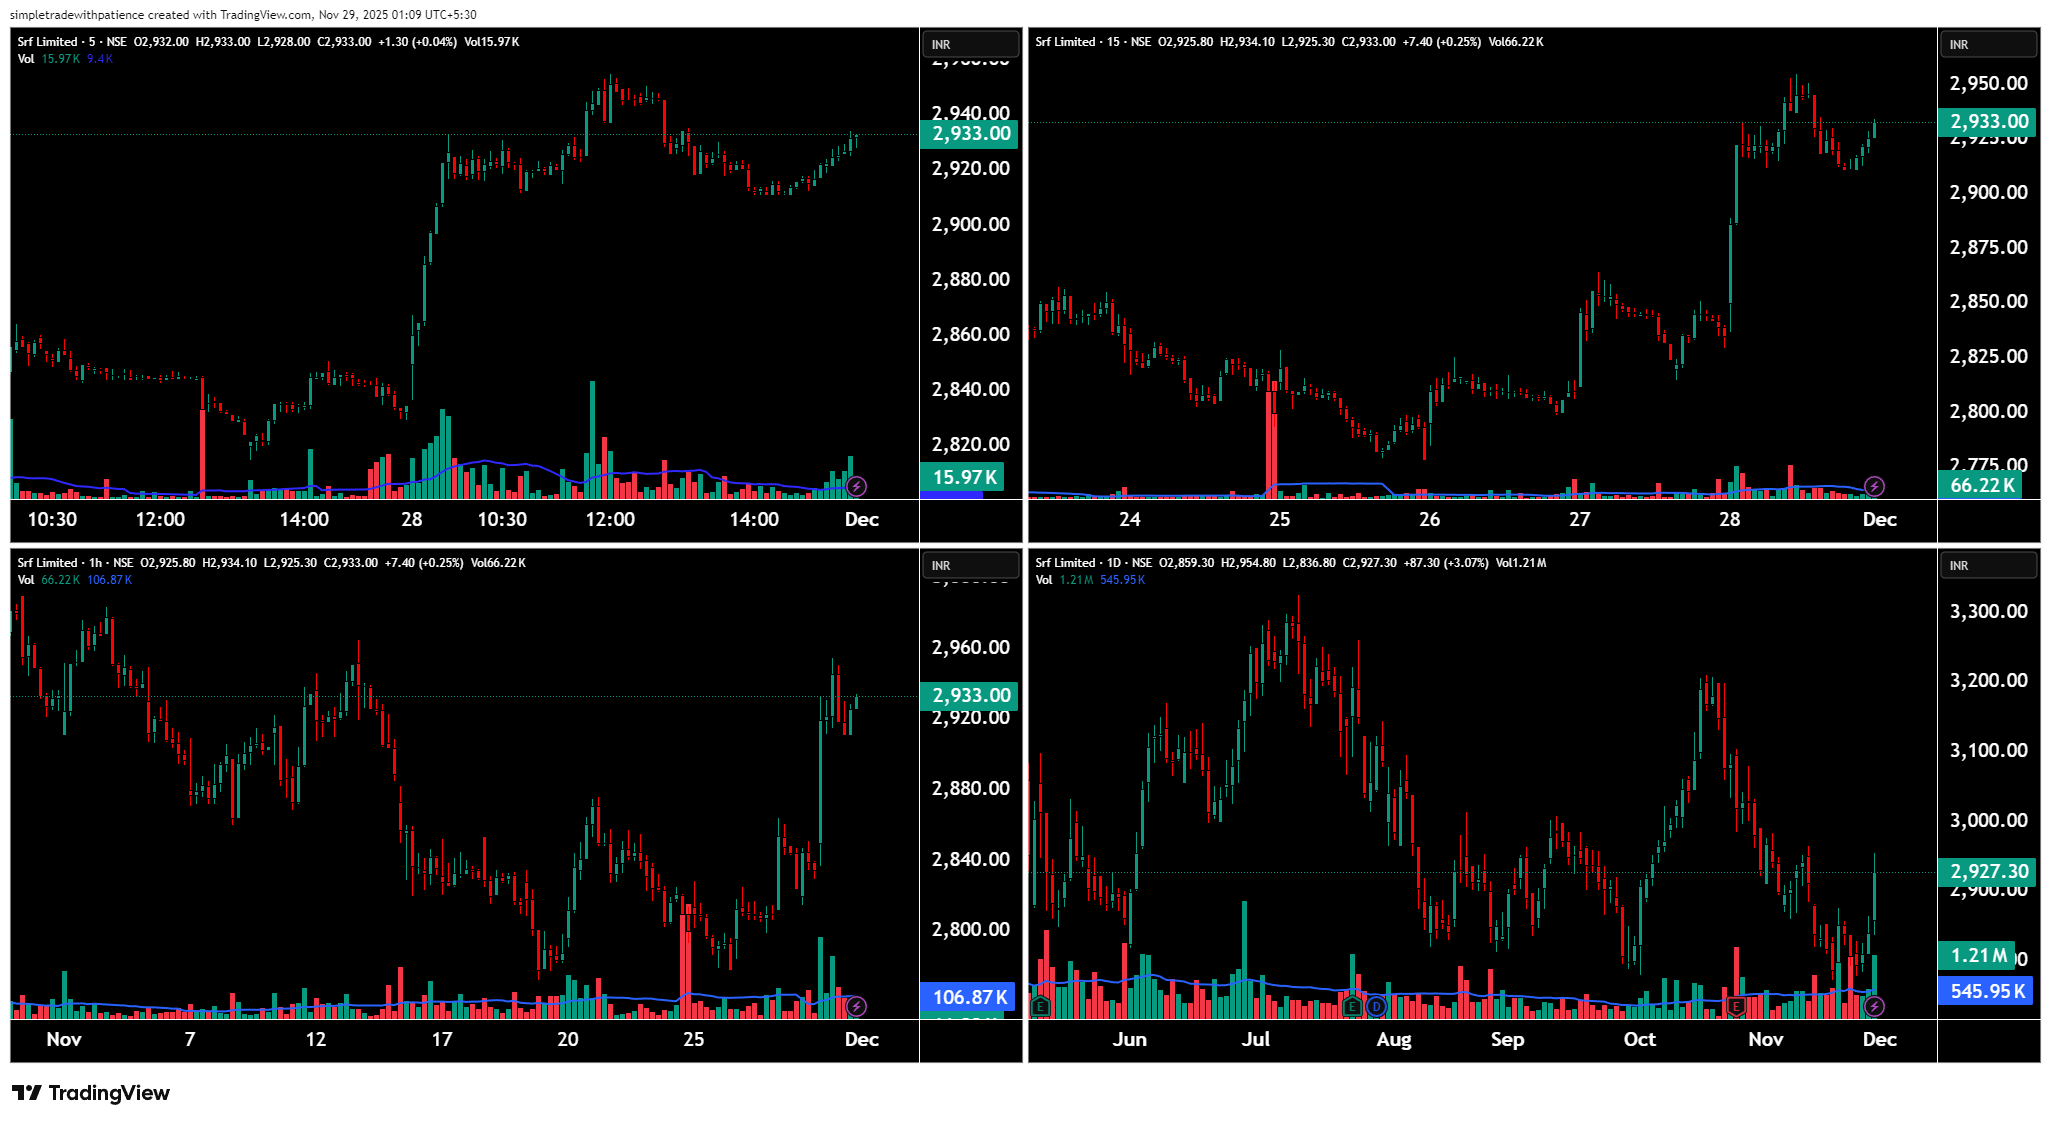
💹 SRF Ltd (NSE: SRF)
Sector: Chemicals & Industrials | CMP: 2933.00 | View: Bullish Momentum — Fresh Long Build-Up, Breakout Attempt in Progress
SRF moved with a confident bullish tone throughout the session. The stock opened steady, dipped slightly toward 2920, and then recovered strongly as buyers stepped in aggressively near the intraday lows. From there, price pushed toward 2940, showing that demand was active on small declines while sellers were largely ineffective. Volume spikes on green candles confirmed genuine buying interest rather than noise-driven moves.
On the larger timeframe, the structure has turned decisively bullish after weeks of choppy consolidation. The stock has reclaimed the crucial 2880–2900 supply zone and is now attempting to push into higher levels. The broader range sits between 2820 as a base and 3020–3050 as the upper band. Every decline into 2820–2850 has been absorbed quickly, while breaks above 2900 have started attracting fresh momentum. For beginners, the structure is easy: buyers dominate above 2900, sellers appear near 3000–3030, and the stock stays in a bullish breakout attempt as long as it holds above its newly reclaimed support.
Option activity strongly validated this bullish setup. Clean long build-ups were seen across multiple CE strikes including 2950 CE, 3000 CE, 3050 CE, 3100 CE, and 3150 CE — a clear sign that traders expect upside continuation. These strikes carried healthy deltas in the 0.23–0.50 range, offering reliable directional sensitivity.
Short covering was active in the lower strikes like 2900 CE and 2850 CE, indicating that short positions are steadily getting exited as price strengthens. On the put side, most strikes showed short build-up or long unwinding, confirming that traders do not expect meaningful downside. IV around the 22–24 region offered a balanced environment for call buyers — neither too expensive nor too flat. Altogether, the option chain displayed broad bullish alignment with strong participation.
In simple terms:
• Staying above 2910–2920 keeps the long setup active.
• A clean move above 2950–2960 can accelerate momentum.
• Only a fall below 2880 weakens the breakout structure.
For the next session, 2920 is the key level to track. If the stock holds above it, a push toward 2960–2990 looks likely, with an extended move possible toward 3020 if volumes remain strong. A failure to hold 2920 could trigger a dip toward 2880–2895, where buyers may attempt to re-enter. For directional options, the cleanest strikes are 2950 CE or 3000 CE, but they should be taken only if the stock holds above 2920 and then breaks 2950 on strong candles (5- or 15-minute close). Exit the option if the premium drops around 20–25% or if spot falls back below intraday support.
Avoid trading inside the 2920–2940 noise zone — price often becomes choppy here, causing quick premium decay. Focus on decisive levels, breakout candles, and volume-backed moves. As long as SRF sustains above 2880–2920, the bullish breakout attempt remains valid. Losing this region shifts attention back to the base near 2820. Monitor OI clusters — sudden shifts often signal the next directional swing clearly.
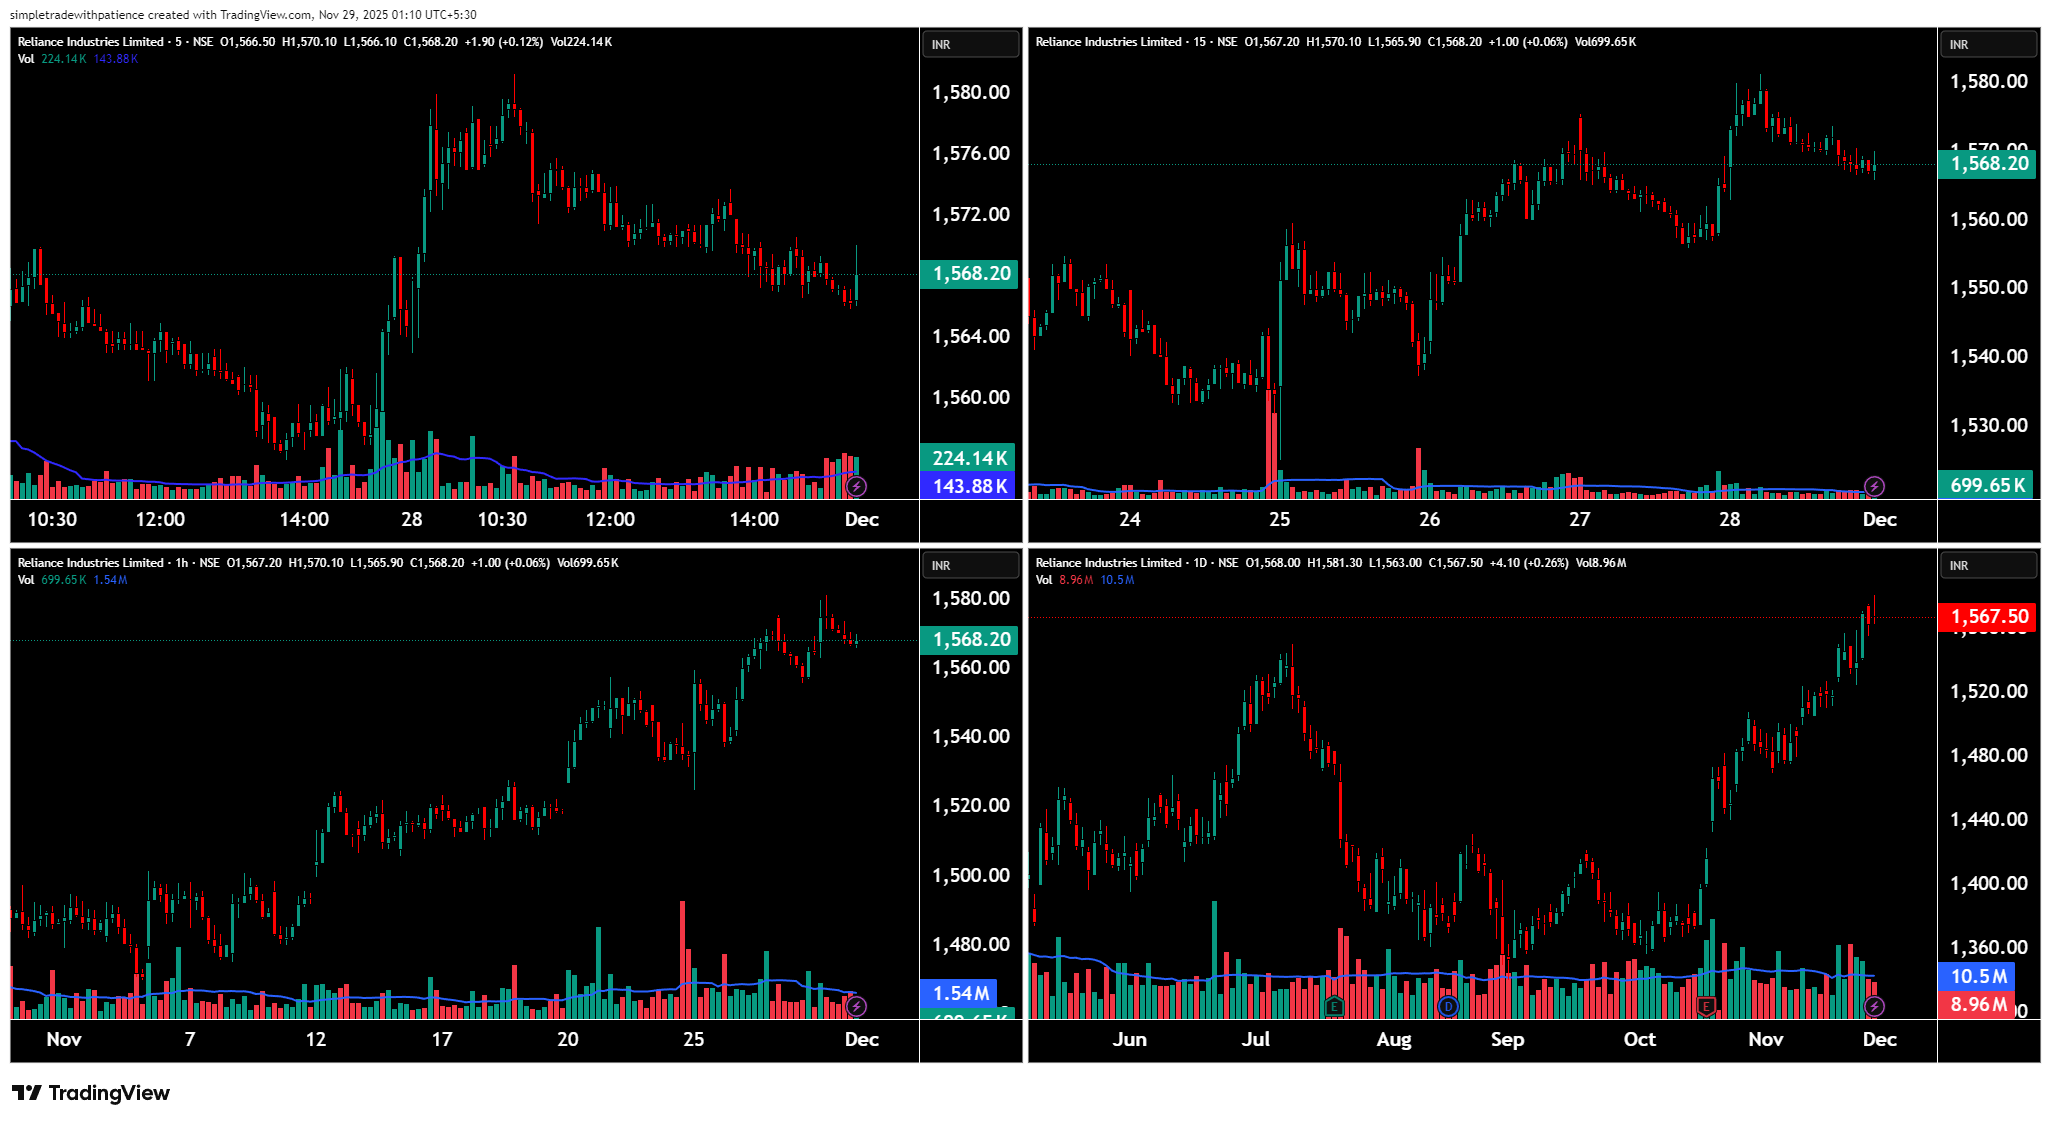
💹 Reliance Industries Ltd (NSE: RELIANCE)
Sector: Energy & Diversified Conglomerate | CMP: 1568.20 | View: Bullish Continuation — Steady Uptrend with Strong CE Participation
Reliance traded with a controlled bullish tone throughout the session. The stock opened near 1566, dipped briefly toward 1560, and then steadily recovered as buyers absorbed every minor decline. The intraday behaviour showed clean demand pockets—green candles attracted volume, while red candles saw lighter participation, indicating that sellers were unable to take control. Toward the second half, the price stabilised around 1565–1570, reflecting quiet accumulation rather than exhaustion.
On the bigger timeframe, the structure is clearly upward trending. After weeks of climbing from the 1450–1500 base, the stock is now consistently forming higher highs and higher lows. The broader demand zone sits around 1530–1545, where the stock was earlier accumulated heavily, while the upper supply band lies around 1585–1600. Every small dip into the mid-level zones (1550–1560) has been bought aggressively, and the breakout above 1550 remains valid as long as the stock holds above its rising support. For beginners, the structure is simple: buyers dominate above 1550, minor sellers appear near 1585–1600, and the trend continues higher as long as the stock stays above its higher-low formation.
Options activity strongly backs this bullish trend. Heavy long build-up was seen across multiple CE strikes including 1580 CE, 1590 CE, 1600 CE, 1630 CE, and several others. These strikes carried deltas between 0.23–0.55, offering a mix of reliability and convexity. Long build-up in lower strikes like 1580 CE and 1590 CE shows traders expect continuation rather than a reversal.
Short covering was seen in 1540 CE, 1550 CE, 1520 CE, indicating that previously short sellers are exiting as momentum strengthens.
On the PE side, multiple strikes showed short build-up or long unwinding, confirming that downside expectations remain weak. IV stayed around the 14.5–16.5 zone, keeping premiums relatively cheap — a favourable environment for call option buyers. Overall, the chain displays broad bullish alignment with systematic accumulation.
In simple terms:
• Holding above 1560 keeps the trend intact.
• Crossing 1575–1580 can open a smooth path to 1595–1605.
• Only a fall below 1545 weakens the short-term trend.
For the next session, 1560 will act as the main support to watch. If the stock stays above this area and builds strength, a move toward 1585–1600 becomes likely. A slip under 1560 could bring a dip toward 1545–1550, where buyers may again re-enter. For directional options, the cleanest setups are 1580 CE or 1590 CE, but they should be taken only if the stock holds above 1560 and then clears 1575–1580 on strong candles (5- or 15-minute confirmation). Exit if premiums drop 20–25% or if spot closes back below the breakout zone.
Avoid trading inside the 1560–1570 noise band — this region often creates sideways chop and slower premium movement. Watch for volume spikes, clean rejection wicks, and OI flip zones for your entries. As long as Reliance sustains above 1545–1560, the structure stays bullish. Losing this region would pull the stock into deeper retracements toward earlier demand pockets.
💹 Hindustan Aeronautics Ltd (NSE: HAL)
Sector: Aerospace & Defence | CMP: 4540.00 | View: Early Upside Revival — Demand Rebuilding Above Short-Term Support
HAL traded with a steady upward bias through the session. The stock opened near 4539, dipped slightly toward 4537, but quickly found buyers who absorbed the weakness and pushed the price gradually higher. Volumes increased on the green candles, suggesting that institutions were active during the intraday recovery. Toward the end, the price held firmly above 4535–4540, signalling quiet accumulation rather than corrective pressure.
On the broader timeframe, HAL is showing signs of recovery after a sharp decline from the 4800–4900 supply zone. The stock has been attempting to stabilise near the 4400–4450 base, and today’s reclaim of the 4520–4540 region indicates that buyers are again stepping in. The larger structure is still sideways-to-recovering, with key swing supply around 4650–4700 and demand pockets sitting near 4400–4450. For beginners, the easier interpretation is: buyers defended 4400–4450 strongly, the momentum is now turning upward, and fresh strength will be confirmed only if the stock sustains above 4570–4600.
Option activity shows strong bullish behaviour across multiple CE strikes. Heavy long build-up was visible in 4550 CE, 4600 CE, 4650 CE, 4700 CE, and even higher strikes like 4750 CE. These strikes carried deltas in the 0.29–0.54 zone, indicating a healthy balance of probability and convexity. The presence of long build-up at deeper ITM/ATM levels reflects confidence in a further upward move.
Short covering activity at 4450 CE, 4400 CE, 4800 CE, and 4900 CE adds confirmation — previous short sellers have started exiting as trend strength improves.
PE strikes, on the other hand, mostly saw long unwinding or short build-up, signalling that downside expectations are weakening and traders prefer bullish continuation.
IV remained stable around the 22–23.5 band, keeping option premiums reasonable and maintaining a favourable environment for momentum-based call buying.
In simple terms:
• Sustaining above 4540 keeps the bullish recovery intact.
• Moving above 4570–4600 can open a push toward 4650–4700.
• A slip below 4480 may slow down momentum but still finds support near 4450.
For the next session, the key level to monitor is 4540. If the stock stays above this zone and builds on strength, a move toward 4600 becomes likely. If it loses 4540 and fails to bounce back, expect a drift toward 4480–4500. For directional options, the cleaner picks are 4550 CE or 4600 CE, but only after the stock holds above 4540 and then breaks past 4570–4580 on strong candles (5- or 15-minute confirmation required). Exit on a 20–25% premium drop or if spot falls back below the intraday breakout level.
Avoid trading inside 4525–4545, which often becomes a noise band where premiums decay faster. Watch for volume expansion, shifts in OI at 4600/4650 strikes, and any sharp rejection wicks — these often reveal the next directional move. As long as HAL sustains above 4540 and respects higher-lows, the bias stays positive. Losing 4480 could open a deeper retest toward 4450.
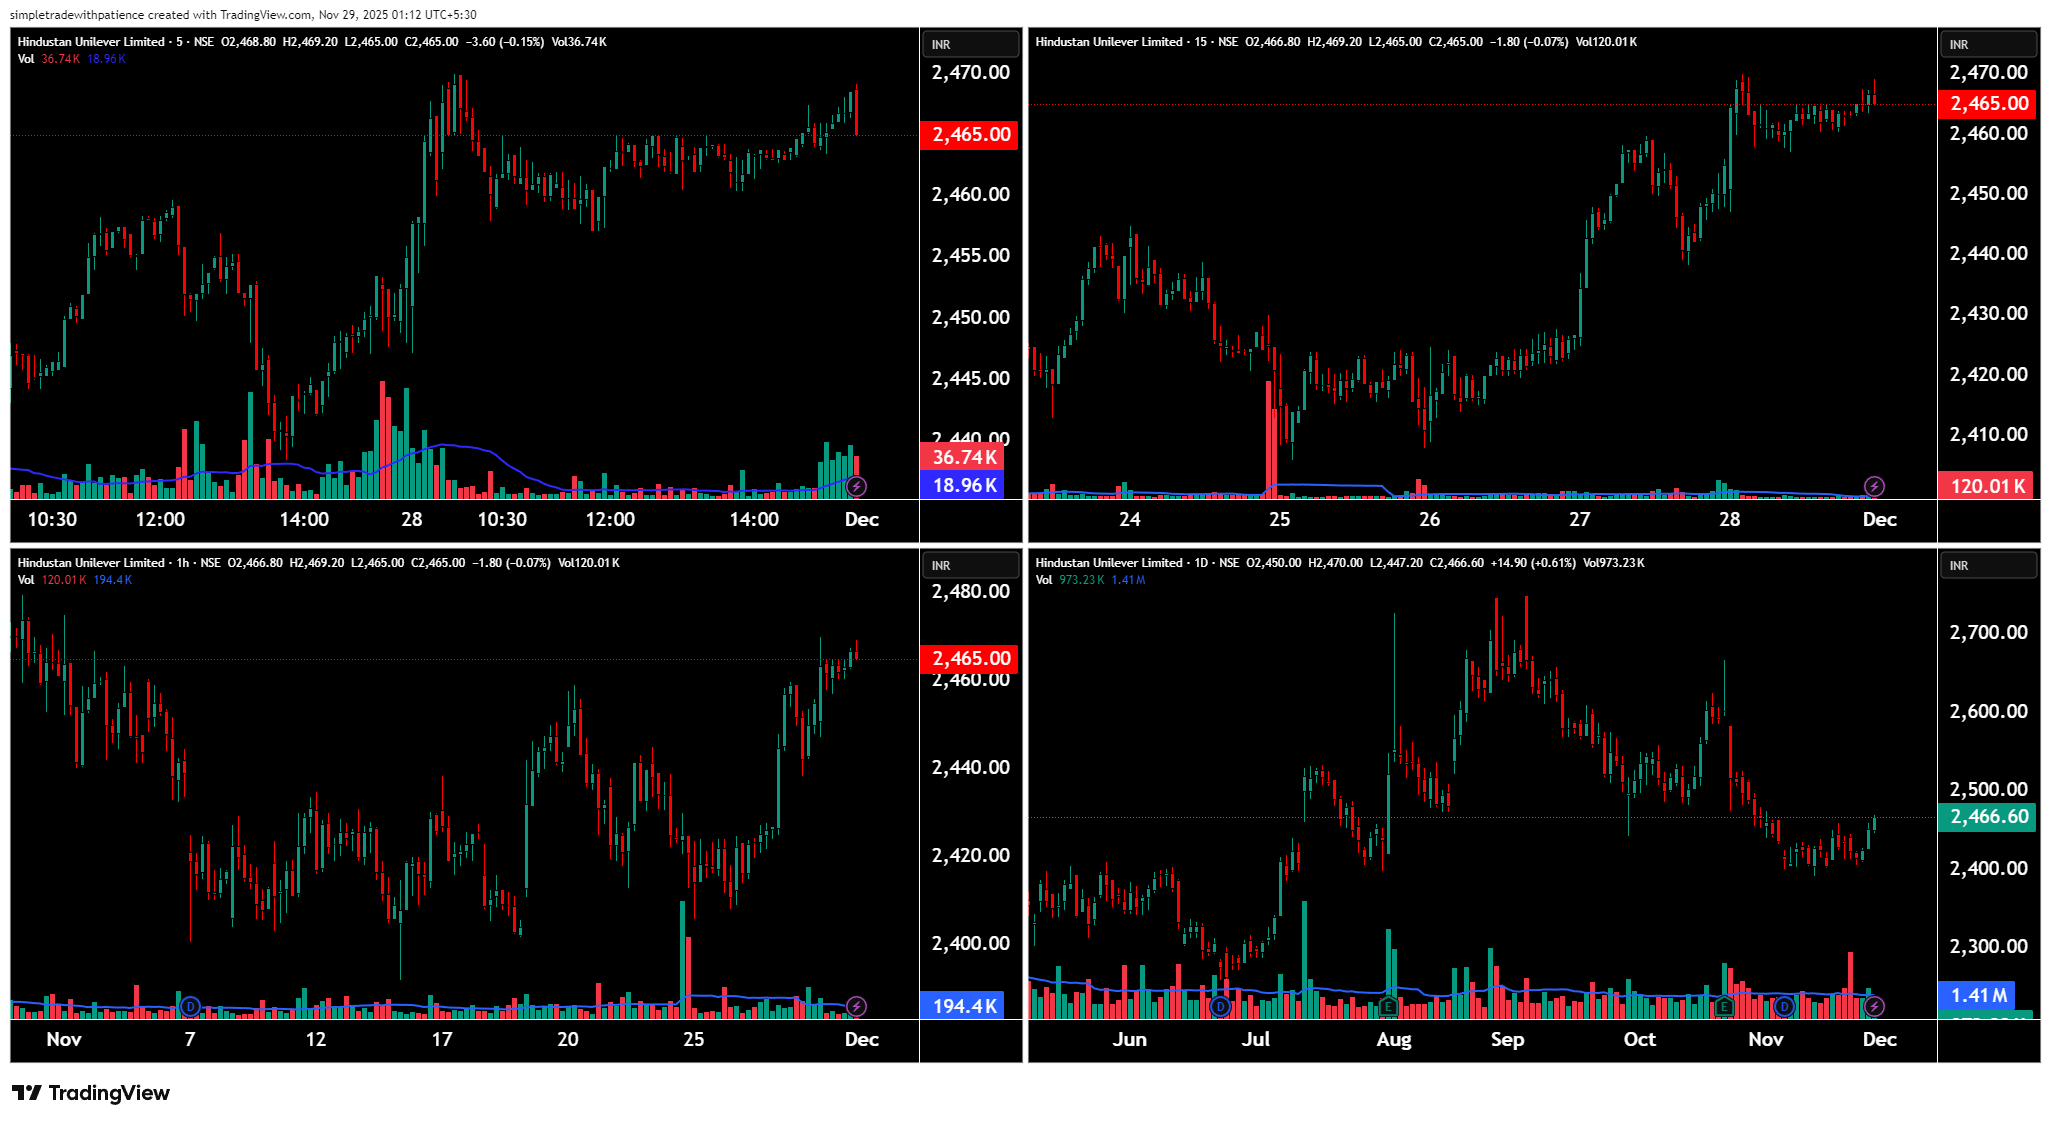
💹 Hindustan Unilever Ltd (NSE: HINDUNILVR)
Sector: FMCG | CMP: 2465.00 | View: Gradual Upside Rotation — Buyers Regaining Control Near Multi-Day Support
HINDUNILVR spent the session in a controlled upward drift. Price held firmly above 2460, with mild dips toward 2450 being quickly absorbed. Intraday candles showed tight consolidation followed by higher pushes, a behaviour typical of FMCG names during early accumulation phases. Volumes were steady, with green candles showing slightly stronger participation — indicating quiet institutional activity rather than speculative bursts.
On the broader timeframe, the stock has been recovering after a multi-week decline from the 2600–2700 region. The base formed around 2380–2420 has started to attract buyers again, and today’s sustained move above 2455–2460 suggests that the stock is attempting to transition out of the lower range. The structure is still stabilising, but the shift from lower-lows to flat lows + higher highs shows that momentum is gradually rotating to the upside.
For beginners, the simple view is:
HUL has built a demand base near 2400–2420, and buyers defended it strongly. The stock is now attempting an early reversal phase toward 2500+.
Option data supports the upward bias cleanly. Strong long build-up appeared in 2500 CE, 2540 CE, 2480 CE, 2560 CE, with deltas in the 0.14–0.52 band — indicating balanced convexity and good probability zones for directional call buying.
Short covering was visible on deeper ITM calls like 2400 CE, 2420 CE, 2440 CE, 2460 CE, showing that previous short sellers are exiting as the trend stabilises.
On the downside, most PE strikes displayed short build-up or long unwinding, signalling bearish pressure fading and a higher chance of continuation on the upside.
IV remains low (7–10 range), making the options cheaper compared to market peers — favourable for buyers who prefer lower extrinsic risk.
In simple terms:
• Holding above 2460 strengthens the bullish recovery
• Crossing 2485–2495 opens the next leg toward 2520–2540
• If price rejects from 2485 repeatedly, expect a retest toward 2445–2455
• Losing 2440 weakens the structure, and momentum cools toward 2420
For tomorrow, focus on 2460 as the control level. If this holds during the opening hour, a move toward 2485–2500 becomes the natural path. If the stock slips below 2460 and struggles to reclaim it, avoid aggressive longs and wait for a clear setup.
Directionally, the cleanest strikes for momentum trades are 2480 CE or 2500 CE, but only after the stock sustains above 2460 and then clears 2485 with strength (5- or 15-minute confirmation recommended). Manage risk immediately if the premium drops 20–25% or if the spot slides back under the breakout zone.
Avoid engaging inside 2450–2465, which often behaves like a noisy chop band with fast theta decay.
Watch intraday volume spikes near 2480, check OI shifts at 2500/2540, and monitor rejection wicks — these often signal the next strong move.
As long as price respects 2460 and forms higher-lows, the bias stays positive. Only below 2440 does the structure weaken meaningfully.
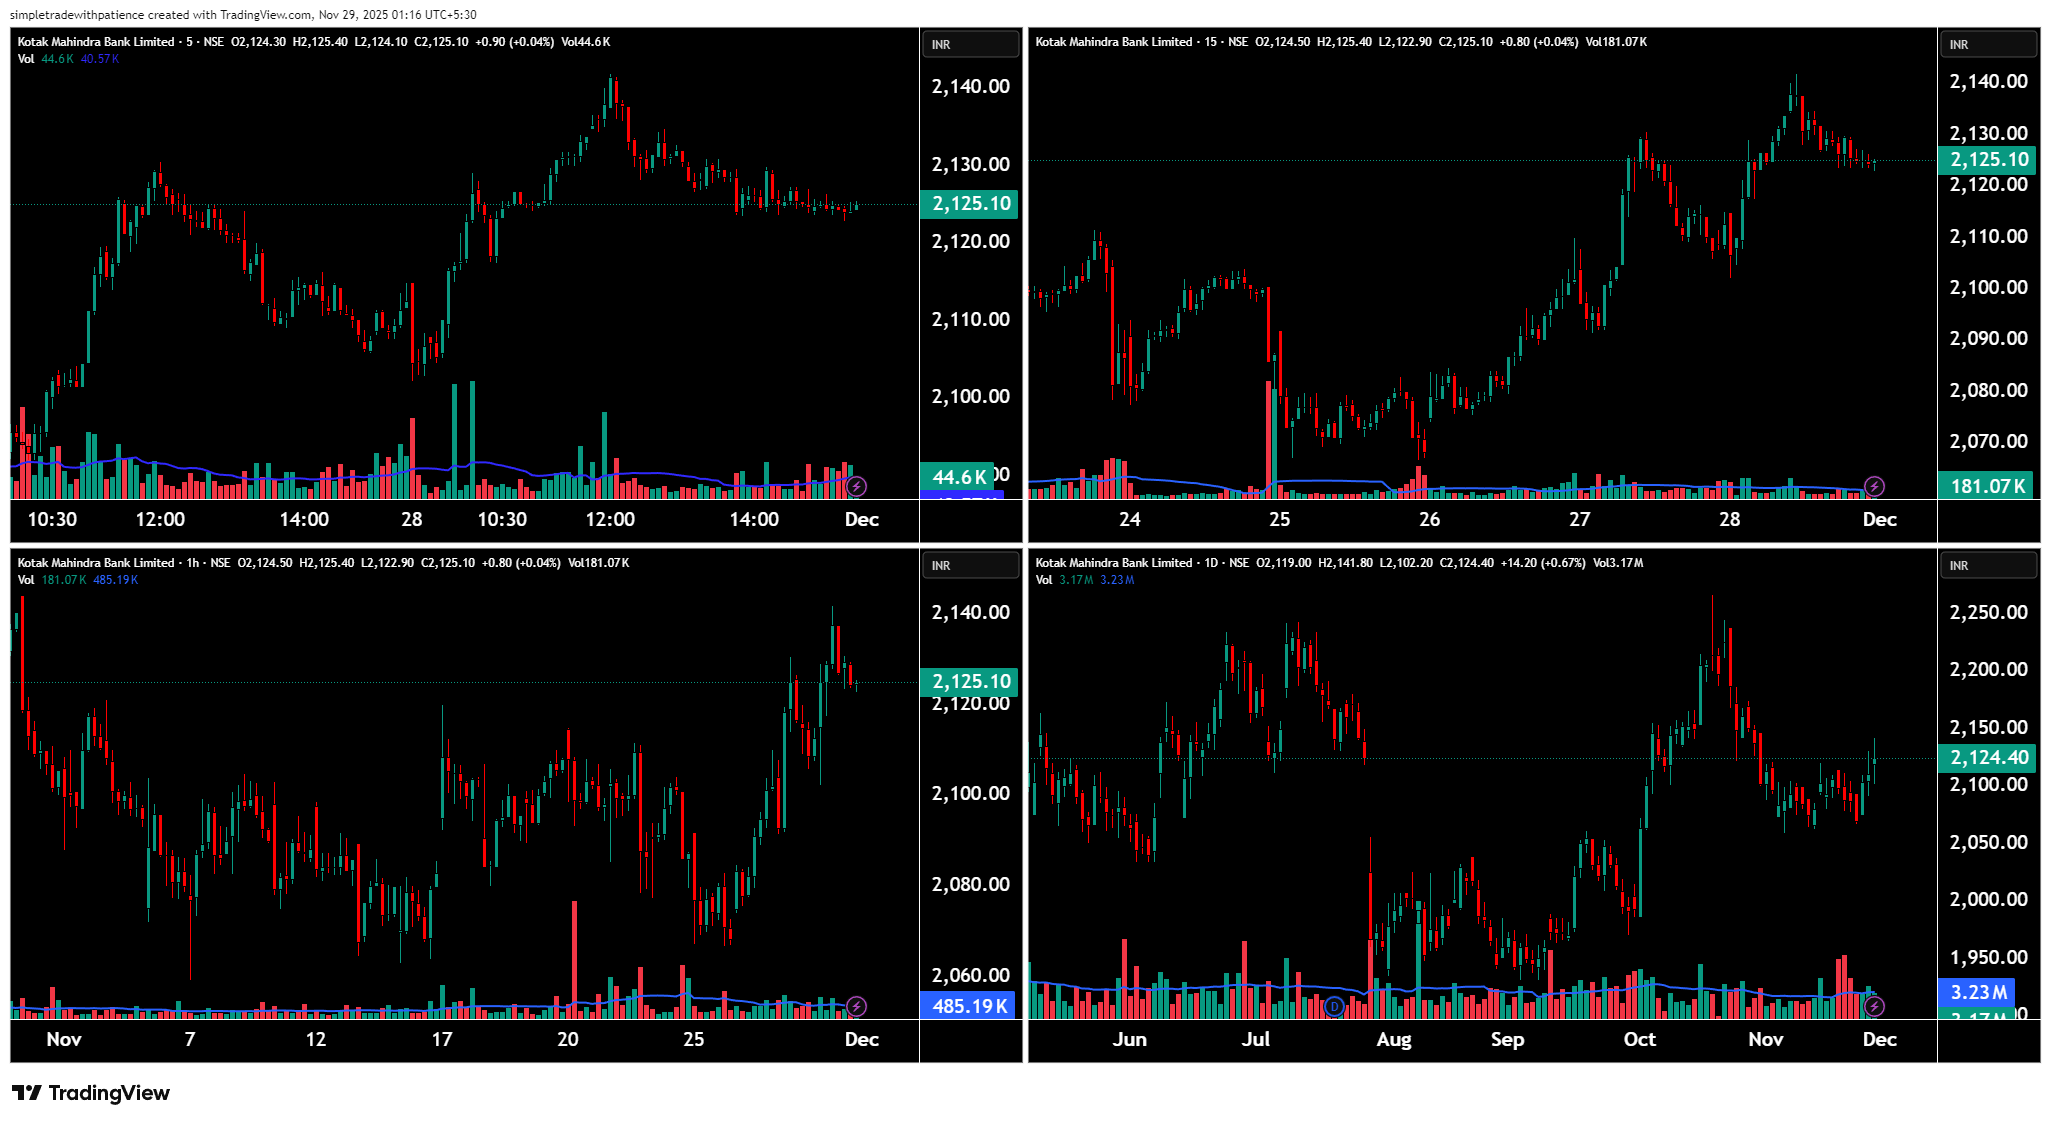
💹 Kotak Mahindra Bank Ltd (NSE: KOTAKBANK)
Sector: Banking & Financial Services | CMP: 2125.10 | View: Range Support Rebound — Early Attempt to Build Higher-Lows
Kotak Bank traded in a restrained but constructive manner throughout the session. The stock opened near 2124–2125, dipped slightly toward 2122, and then moved into a slow, controlled grind back toward the opening zone. Buyers were present during every small dip, but the momentum never expanded enough to trigger a strong directional candle. Volumes remained steady — not aggressive, but consistent enough to show that intraday sellers were not dominant. Through the second half, the price stabilised above 2120–2123, hinting at quiet accumulation near the lower end of the intraday structure.
On the broader timeframe, the stock remains inside a wide consolidation band stretching roughly between 2050–2070 on the downside and 2160–2200 on the upside. After the recent decline from the 2200–2250 supply zone, Kotak Bank attempted a recovery from its base around 2070–2090. The last two sessions show stability: price is respecting higher-lows on hourly charts and is trying to re-enter the 2140–2160 zone, which earlier acted as supply. For a beginner, the clearest interpretation is simple: buyers defended 2070–2090 successfully; sellers are active near 2140–2160; a breakout or breakdown is required for a clean trend.
Option activity reflects a cautious yet bullish environment. Strong long-build-up was visible in 2180 CE, 2160 CE, and 2300 CE, which carried deltas in the 0.34–0.42 band — a sweet zone where both probability and convexity align. These strikes help identify where directional traders are positioning for continuation.
Moderate strikes like 2200 CE, 2220 CE, 2140 CE, 2120 CE, and 2100 CE showed short covering behaviour, indicating that earlier short sellers are stepping aside as the price finds stability.
On the put side, the activity was mostly weak — a mix of short build-up at 2100 PE, 2120 PE, 2140 PE and long unwinding at deeper strikes like 2080 PE, 2060 PE, 2040 PE. This suggests traders do not expect a strong downside; instead, they see dips as opportunities for bullish continuation.
IV remained stable around the 15.3–16.5 zone, keeping premiums balanced and maintaining favourable conditions for directional call buying if momentum develops.
In simple terms:
• Holding above 2120 keeps the bullish recovery structure valid.
• Sustaining above 2140–2160 can open the door toward 2180–2200.
• A slip below 2105–2110 weakens momentum and can retest 2085–2095.
For the upcoming session, the most important level to track is 2120. If the stock sustains above this region and moves past 2140 with strength, a move toward 2160, and eventually 2180, becomes more probable. For momentum-based trades, the cleaner choices are 2160 CE or 2180 CE, but only after the stock holds above 2120 and then pushes past 2140–2150 with conviction on a 5- or 15-minute breakout. Exit the trade if the premium drops 20–25% or if the stock falls back below the breakout zone.
Avoid trading inside 2115–2130, which is a noise-heavy region with frequent rejections and fast premium decay. Watch for volume bursts and changes in OI around 2160/2180 CE and 2100/2120 PE, as these levels often give early clues about direction. As long as Kotak Bank holds above 2120 and continues printing higher-lows, the bias stays mildly bullish. Losing 2105–2110 would temporarily shift the stock back into a deeper consolidation.
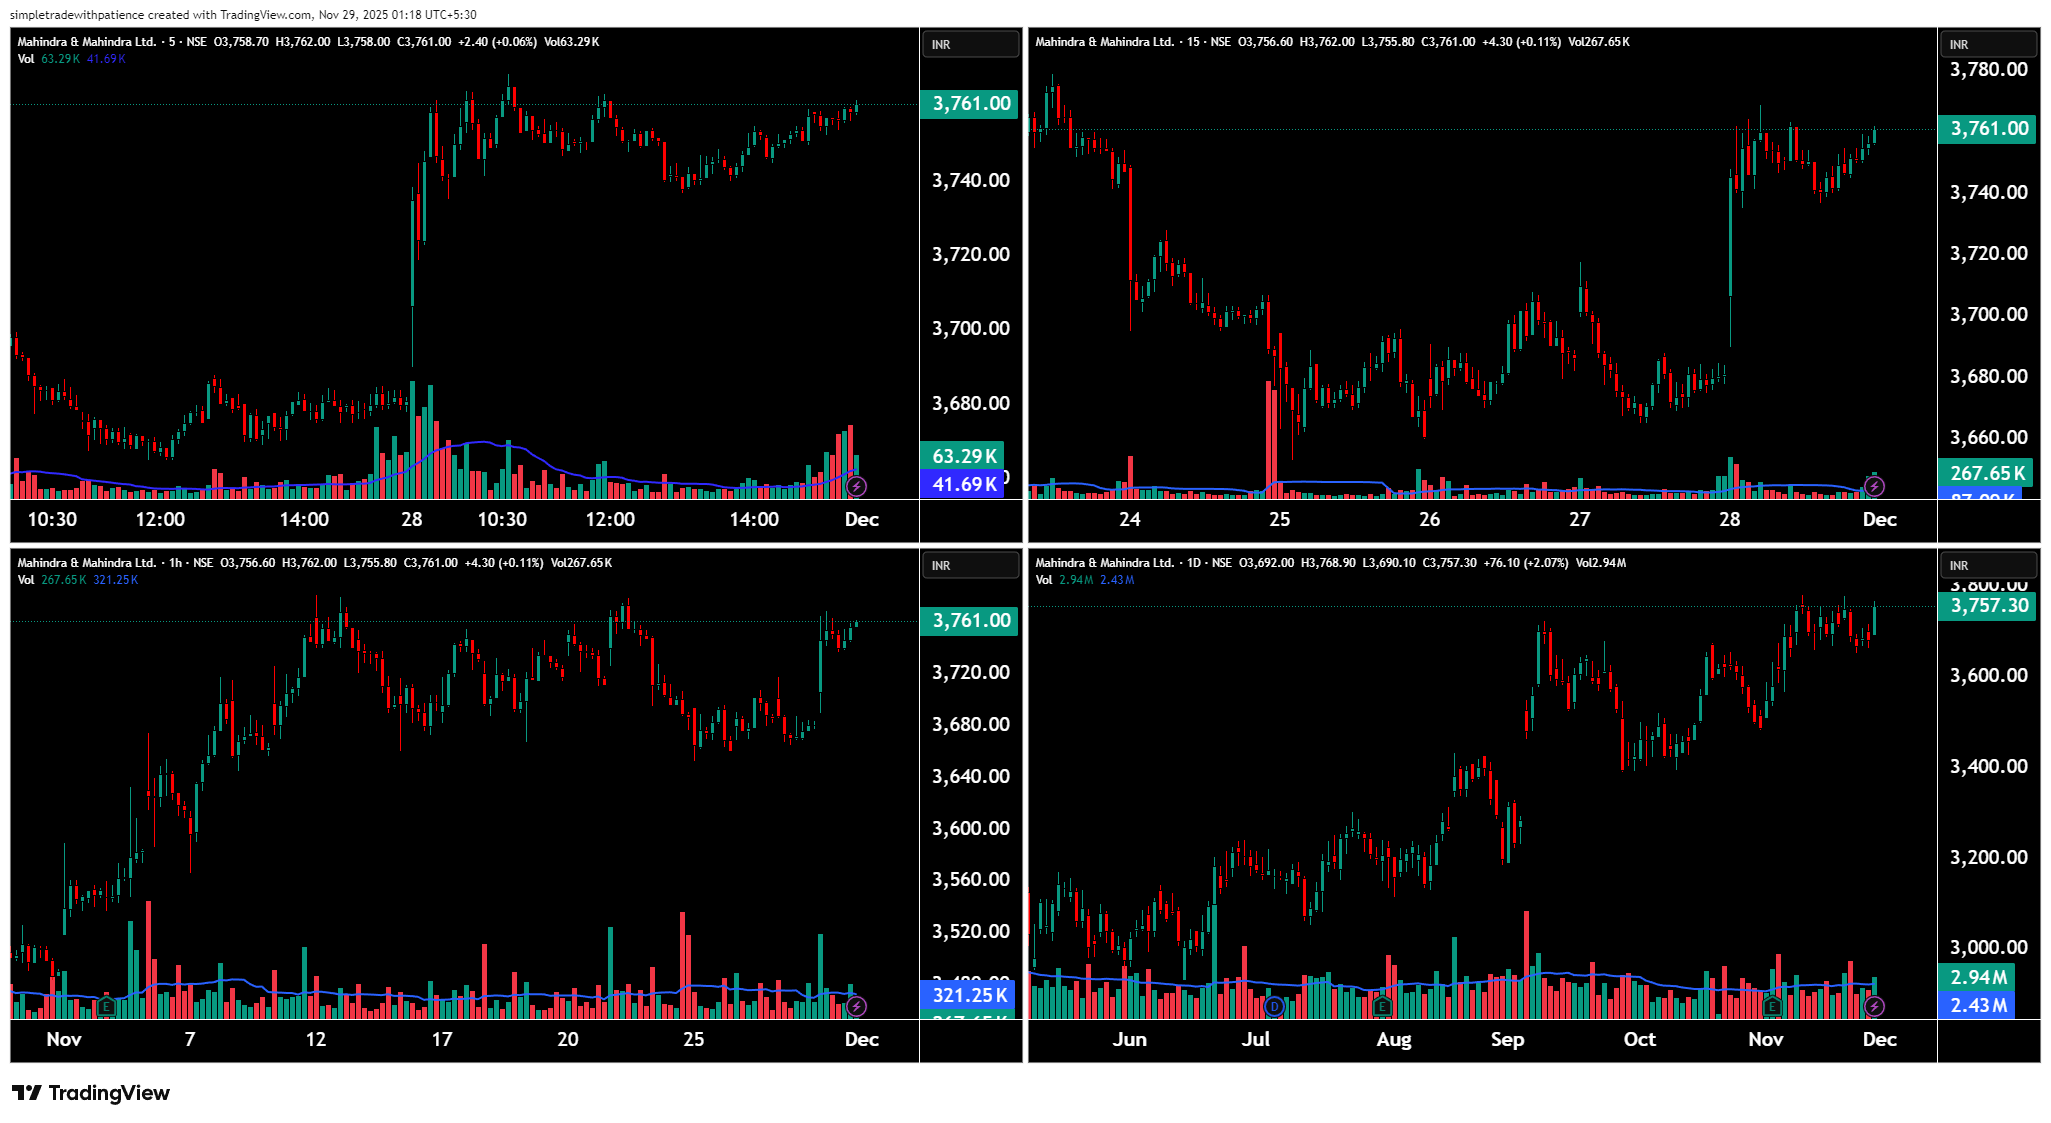
💹 Mahindra & Mahindra Ltd (NSE: M&M)
Sector: Automobiles | CMP: 3761.00 | View: Strong Uptrend Extension — Buyers Firmly in Control
M&M continued its upward trajectory through today's session with steady strength. The stock opened near 3758, briefly slipped to test intraday support, but quickly attracted aggressive buying that pushed it back above 3760. Volumes expanded on the green candles, reflecting active participation from institutions and short-term momentum traders. The intraday structure was clean — higher lows, controlled pullbacks, and persistent demand within every dip phase.
On the broader timeframe, M&M has been forming a strong base above the 3600–3650 zone after a healthy correction earlier this month. The recent breakout above 3720 has turned this level into an immediate support band. The daily chart now shows a classic continuation pattern: buyers absorbed selling pressure near 3680–3700 and reclaimed the upper channel, indicating readiness for further upside. Supply zones are stacked around 3800–3850, while deeper demand sits at 3600, making the trend structure bullish with strong follow-through potential if momentum sustains.
Option activity supports this bullish tone. Strong long build-up dominated key CE strikes like 3650 CE, 3750 CE, 3800 CE, 3850 CE, and 3900 CE — all showing rising OI with price expansion. These strikes carried deltas between 0.40 and 0.71, suggesting traders are positioning for continuation rather than quick scalps.
Short covering was seen in 3600 CE and 3700 CE, indicating that short sellers are rapidly exiting as the underlying strengthens.
On the PE side, multiple strikes displayed short build-up (3600 PE, 3650 PE, 3700 PE, 3750 PE), reflecting reduced expectations for a downside move and a preference for bullish momentum continuation.
IV stayed stable in the 21–23 band, ideal for directional call buyers — premiums are not overheated, and moves tend to behave cleanly.
In simplified terms:
• Holding above 3720 keeps the trend comfortably bullish.
• A clean push above 3780–3800 can unlock extensions toward 3850–3900.
• A dip below 3700 may slow momentum, but buyers should reappear near 3680–3695.
For the next session, your focus zone is 3750–3765. Sustaining above this area can trigger a smooth breakout into 3800. If the stock hesitates near 3780–3800, wait for a retest back toward 3740–3755 and take confirmation-based entries.
Directional traders will find 3750 CE, 3800 CE, or 3850 CE cleaner, but only if the stock stays firm above 3750 and then breaks past 3780 with volume confirmation on 5- or 15-minute charts.
Manage exits on 20–25% premium erosion or a drop back below the intraday breakout zone.
Avoid trading inside 3735–3760, which tends to be a congestion pocket with slower option moves. Look for volume spikes, OI build-up at 3800/3850 strikes, and candle rejections at higher levels — these reveal whether breakout strength is genuine. As long as M&M maintains rising lows and protects 3720, the bias remains strongly bullish. A breakdown below 3680 may trigger a deeper cooling phase.
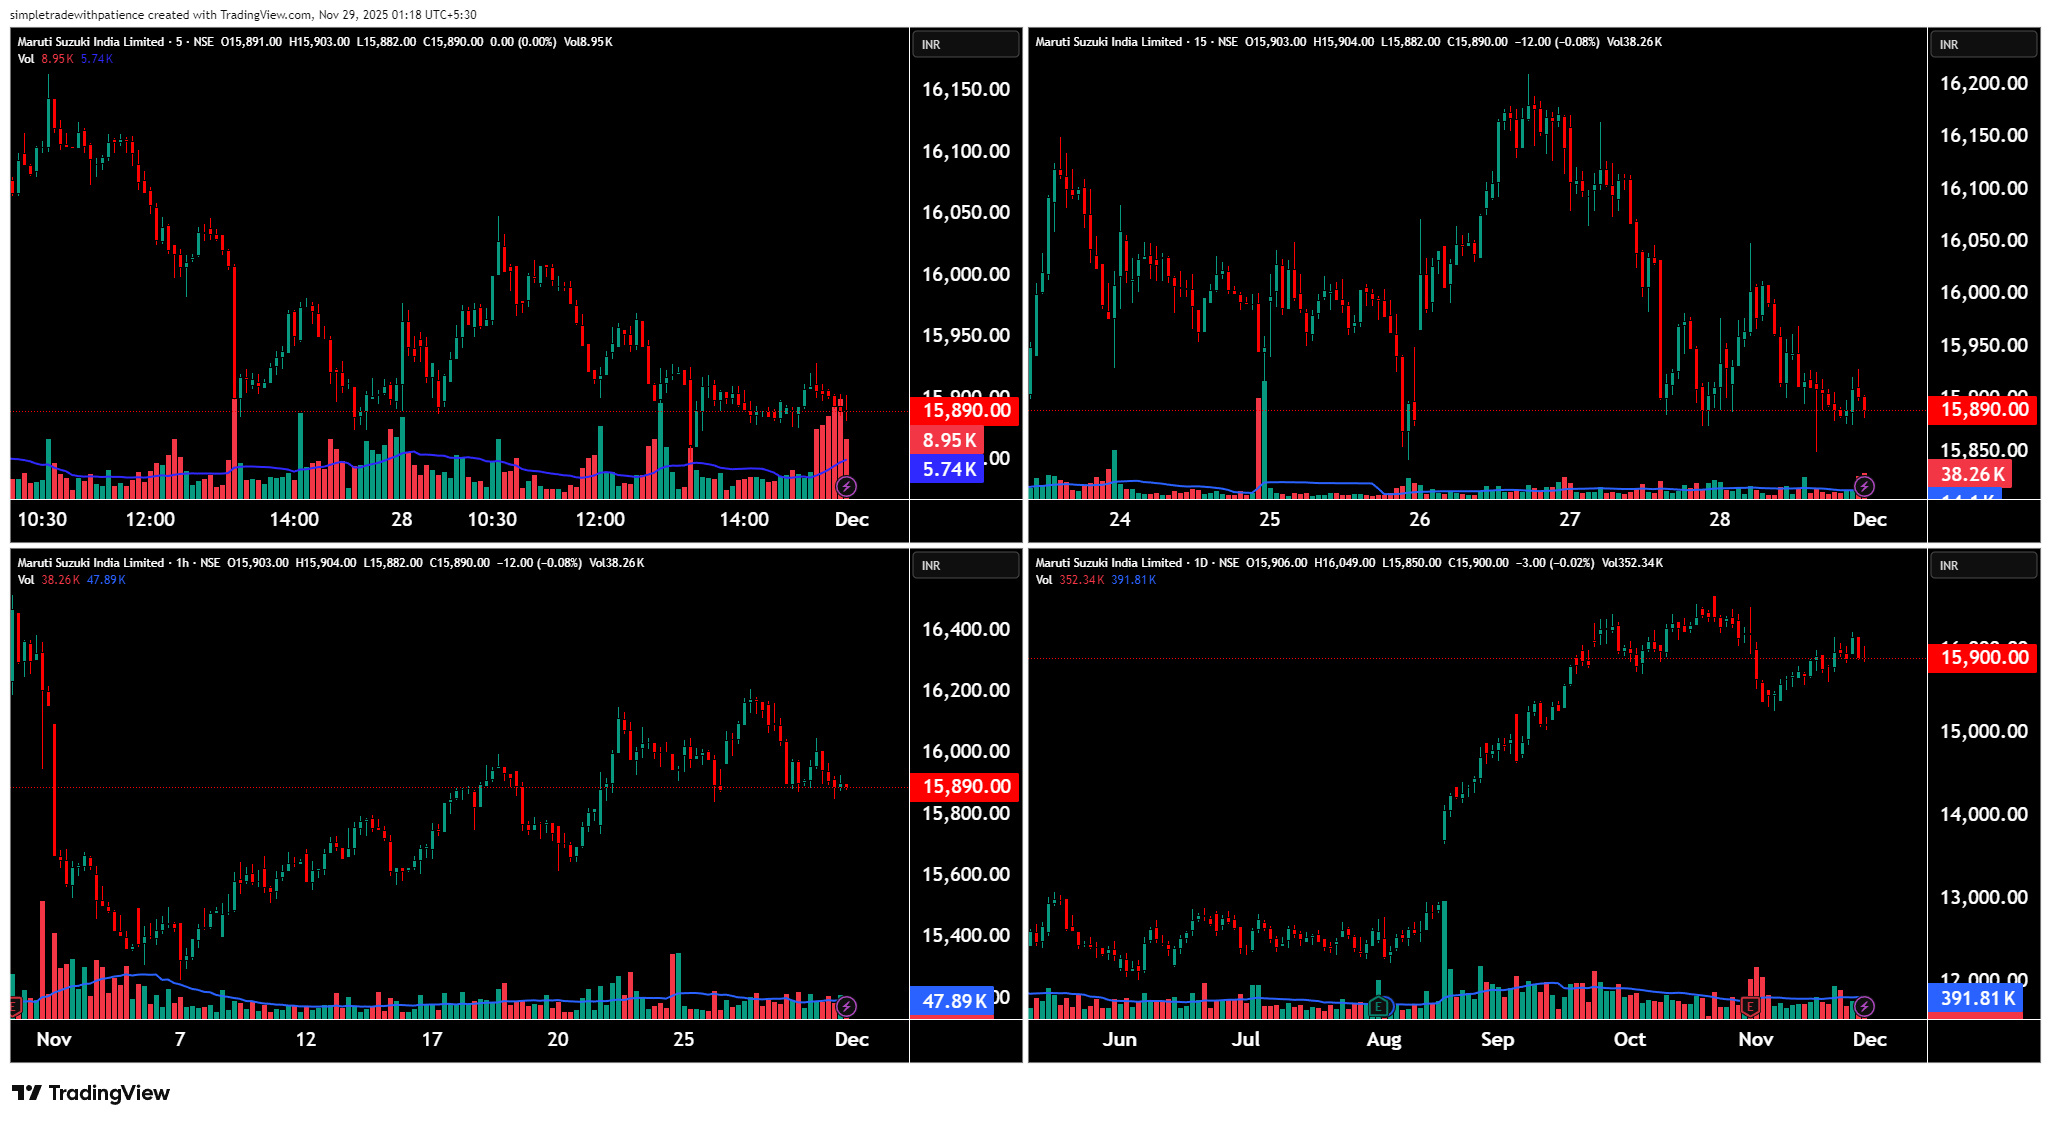
💹 Maruti Suzuki India Ltd (NSE: MARUTI)
Sector: Auto | CMP: 15890 | View: Weakness Near Supply — Downside Bias With Fragile Demand Re-Entry
MARUTI spent the day drifting inside a tight intraday range, failing to attract meaningful buying despite early attempts to stabilise near 15900. The stock opened around 15903, attempted a mild push toward 15910, but sellers quickly absorbed the strength. Through the session, price kept sliding back toward 15870–15890 with visible red-candle volume spikes — a sign that supply was actively defending higher levels. Toward the end, the stock settled near 15890, reflecting a lack of follow-through demand and a preference for caution among intraday traders.
On the broader structure, MARUTI is still struggling below its short-term moving averages after slipping sharply from the 16200–16400 supply zone earlier this week. The stock has been consistently rejected around 16000, and every bounce has faced overhead pressure. Price action on the daily timeframe shows a fading momentum setup — lower highs forming since the mid-November peak and weak attempts to reclaim 16000. The first credible support sits at 15700–15800, while more meaningful buyers step in only near 15500–15600.
For beginners: as long as MARUTI stays below 16000, upside confidence remains limited.
The options chain clearly supports this weakness.
Strong short build-up dominated multiple CE strikes — 16000 CE, 16100 CE, 16200 CE, 16500 CE, 17000 CE, 16600 CE, and even deeper strikes. These scripts saw rising OI with negative price action — a textbook signal of traders reinforcing bearish expectations.
Deltas on these calls stayed in the 0.12–0.56 zone, indicating that premiums demand a directional push which MARUTI did not show during the day. IV around 16.5–17.5 remained stable but did not support sharp call buying.
On the PE side, the picture was mixed — some strikes like 15000 PE saw long build-up (protective bearish positioning), while higher strikes like 15700 PE, 15800 PE, 15500 PE saw short build-up, indicating traders betting that MARUTI may drift but not collapse abruptly.
A few deep PEs like 16200 PE showed long unwinding, meaning bearish aggression softened at higher strikes.
In simple terms:
• Below 16000 — bears stay in control.
• A slip below 15820 may drag price toward 15700.
• Sustaining above 16000 is the only trigger for demand to re-enter meaningfully.
• 16200–16400 remains a hard supply ceiling.
For the next session, the decisive pivot is 15900.
If the stock stays below 15900 and fails to recover early morning strength, expect a drift toward 15820–15750. If it reclaims 15920–15940 with strong green candles and builds structure above 16000, a pullback toward 16100 becomes possible — but this requires clear volume confirmation.
For directional trading, the cleaner setups are on the put side, but only after MARUTI loses 15820 decisively. Avoid chasing options inside the 15850–15950 congestion band. Watch for OI expansion at 16000 CE and 15800 PE — these two strikes will reveal the day’s control zone.
As long as MARUTI remains below 16000 and continues printing lower highs, the broader bias stays negative. A sharp reversal is possible only if fresh institutional volume steps in near 15700 and reclaims 16000 quickly.
💹 One 97 Communications Ltd (NSE: PAYTM)
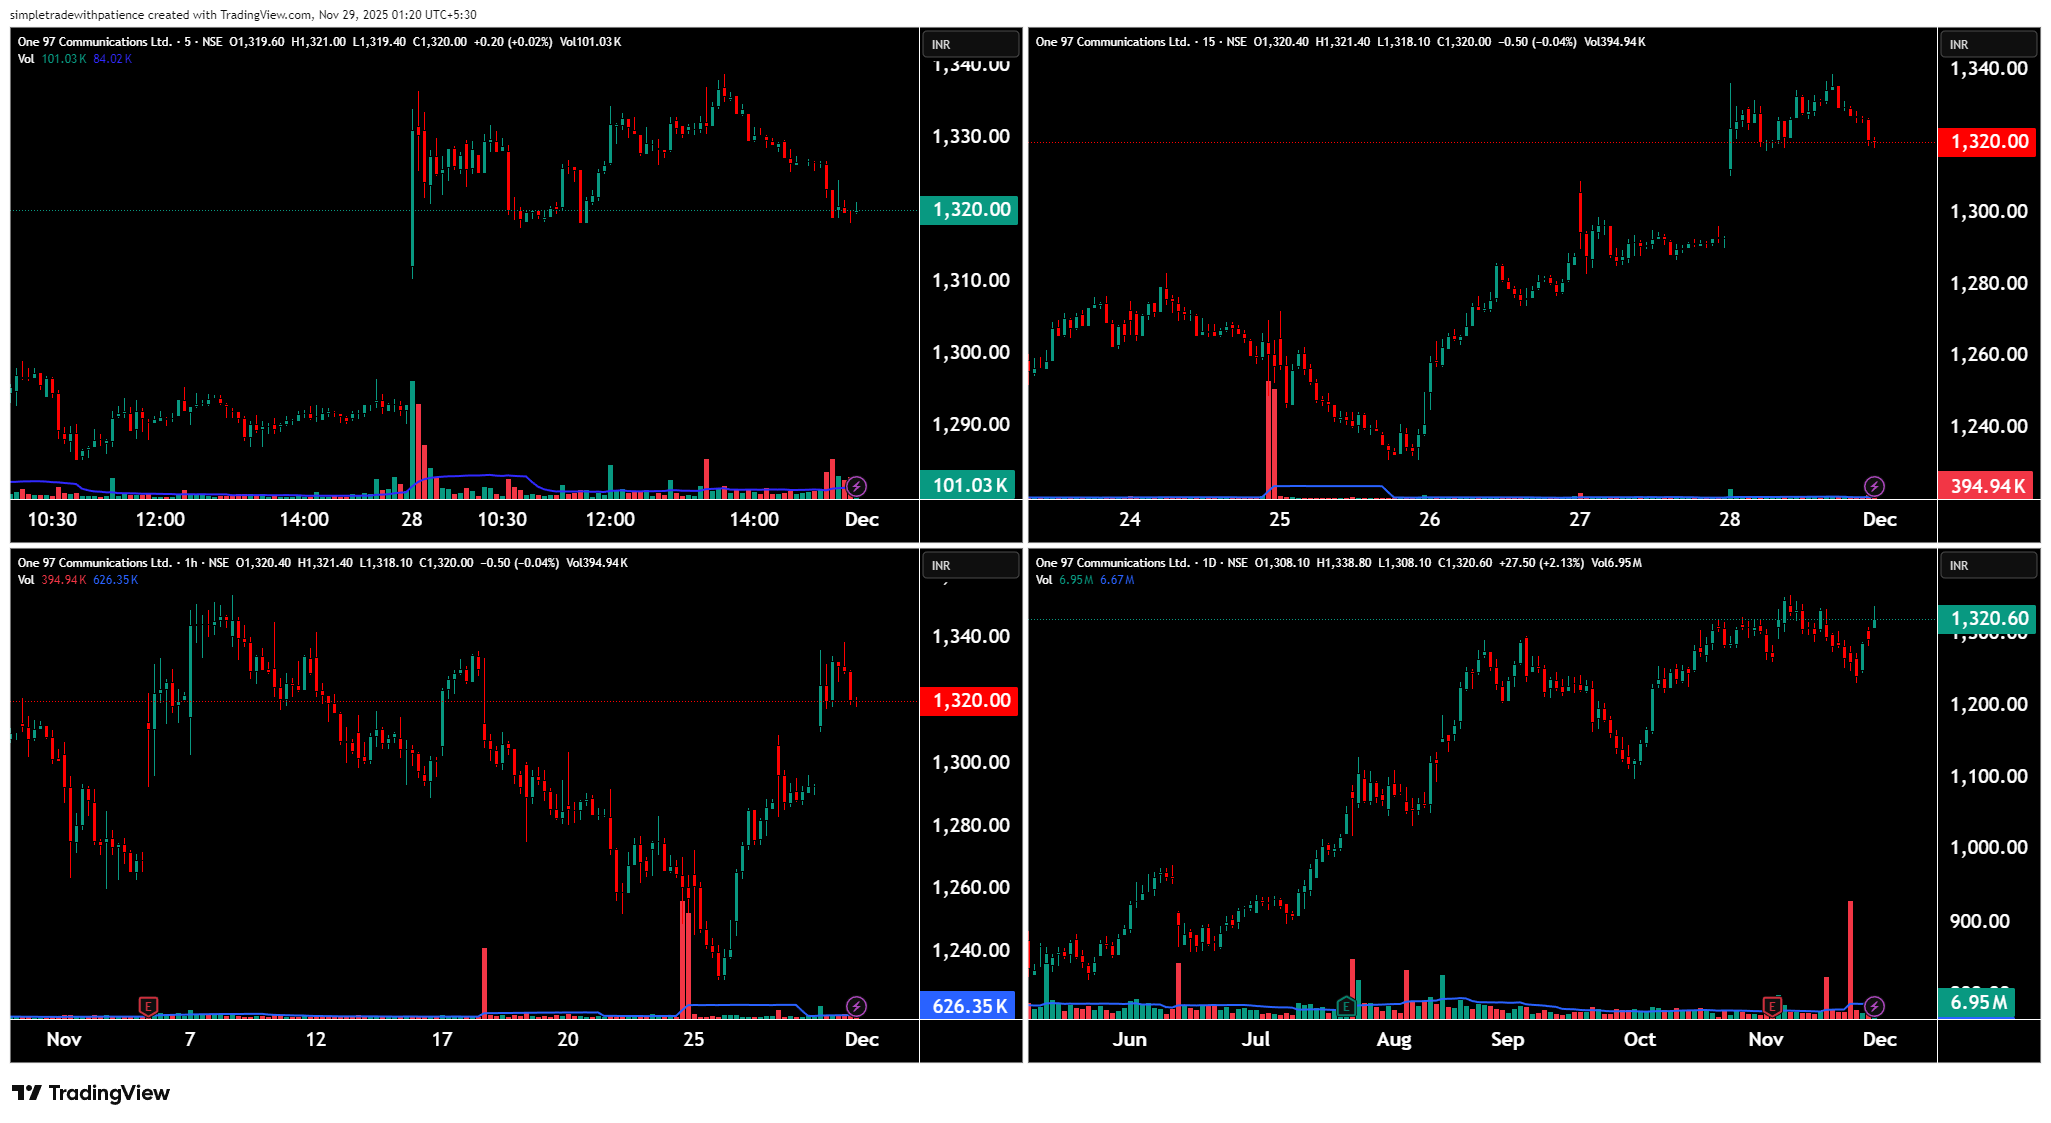
Sector: Fintech & Digital Payments | CMP: 1320 | View: Bullish Continuation — Strong Demand Resurfacing Near 1300 Zone
Paytm spent most of the session in a controlled consolidation with a bullish tilt. Early weakness toward 1318–1320 was swiftly absorbed, and buyers defended the 1305–1315 pocket, keeping pullbacks shallow. Volumes were steady on the recovery candles, signalling that short-term traders continued to add exposure on dips. Toward the later part of the day, price remained stable above the 1315–1320 band, reflecting a phase of quiet accumulation rather than distribution.
On the broader timeframe, Paytm’s structure has completely shifted from the earlier downtrend into a well-defined recovery channel. The stock has reclaimed previous resistance zones around 1290–1300, converting them into fresh demand pockets. The larger daily structure shows higher lows forming consistently since late November, and the stock is now pushing into the 1330–1345 resistance zone. Above this, the next supply region sits at 1360–1380, which will be the decisive breakout area for a stronger continuation leg.
The options data clearly leans bullish. Strong long build-up was seen across strikes 1340 CE, 1360 CE, 1380 CE, 1400 CE, 1420 CE, each carrying strength scores between 4.6 and 4.8 — the highest cluster of the day. These strikes also showed deltas in the 0.28–0.48 range, offering strong convexity and sensible ITM probability. Long build-up at deeper OTM strikes such as 1460 CE and 1500 CE shows confidence that traders are positioning for further upside extensions.
Short covering was evident at 1280 CE, 1300 CE, 1320 CE, confirming that earlier bearish positions are now being exited — a classic marker of trend reversal strength. PE side showed mild short build-up at 1280–1340 Puts, but this aligns with a bullish environment where traders sell downside premiums expecting price stability above 1300.
IV remained stable between 27.2–29.2, keeping call premiums fairly priced and allowing clean momentum trades without excessive volatility.
In simpler words:
• 1300–1310 is the new buy-support zone.
• Sustaining above 1325–1330 keeps the bullish trend active.
• Break above 1345 can open a swift move to 1360–1380.
• Only below 1290 momentum weakens temporarily.
For the next session, the key zone to watch is 1320–1325. As long as the stock holds this area and pushes through 1335–1345, the breakout scenario remains alive. For directional options, the cleanest trades are 1340 CE or 1360 CE, taken only if the stock sustains above 1330 and shows continuation on 5–15 minute candles. Manage risk by exiting on a 20–25% premium reduction or if price slips back under the breakout level.
Avoid trading inside 1310–1320, as this area tends to trap premiums in sideways action. Breakout traders should focus on strength above 1340. Dip buyers should monitor 1305–1310 for responsive demand. As long as Paytm maintains higher lows and continues to attract long build-up on CE strikes, the broader bias stays positively aligned.
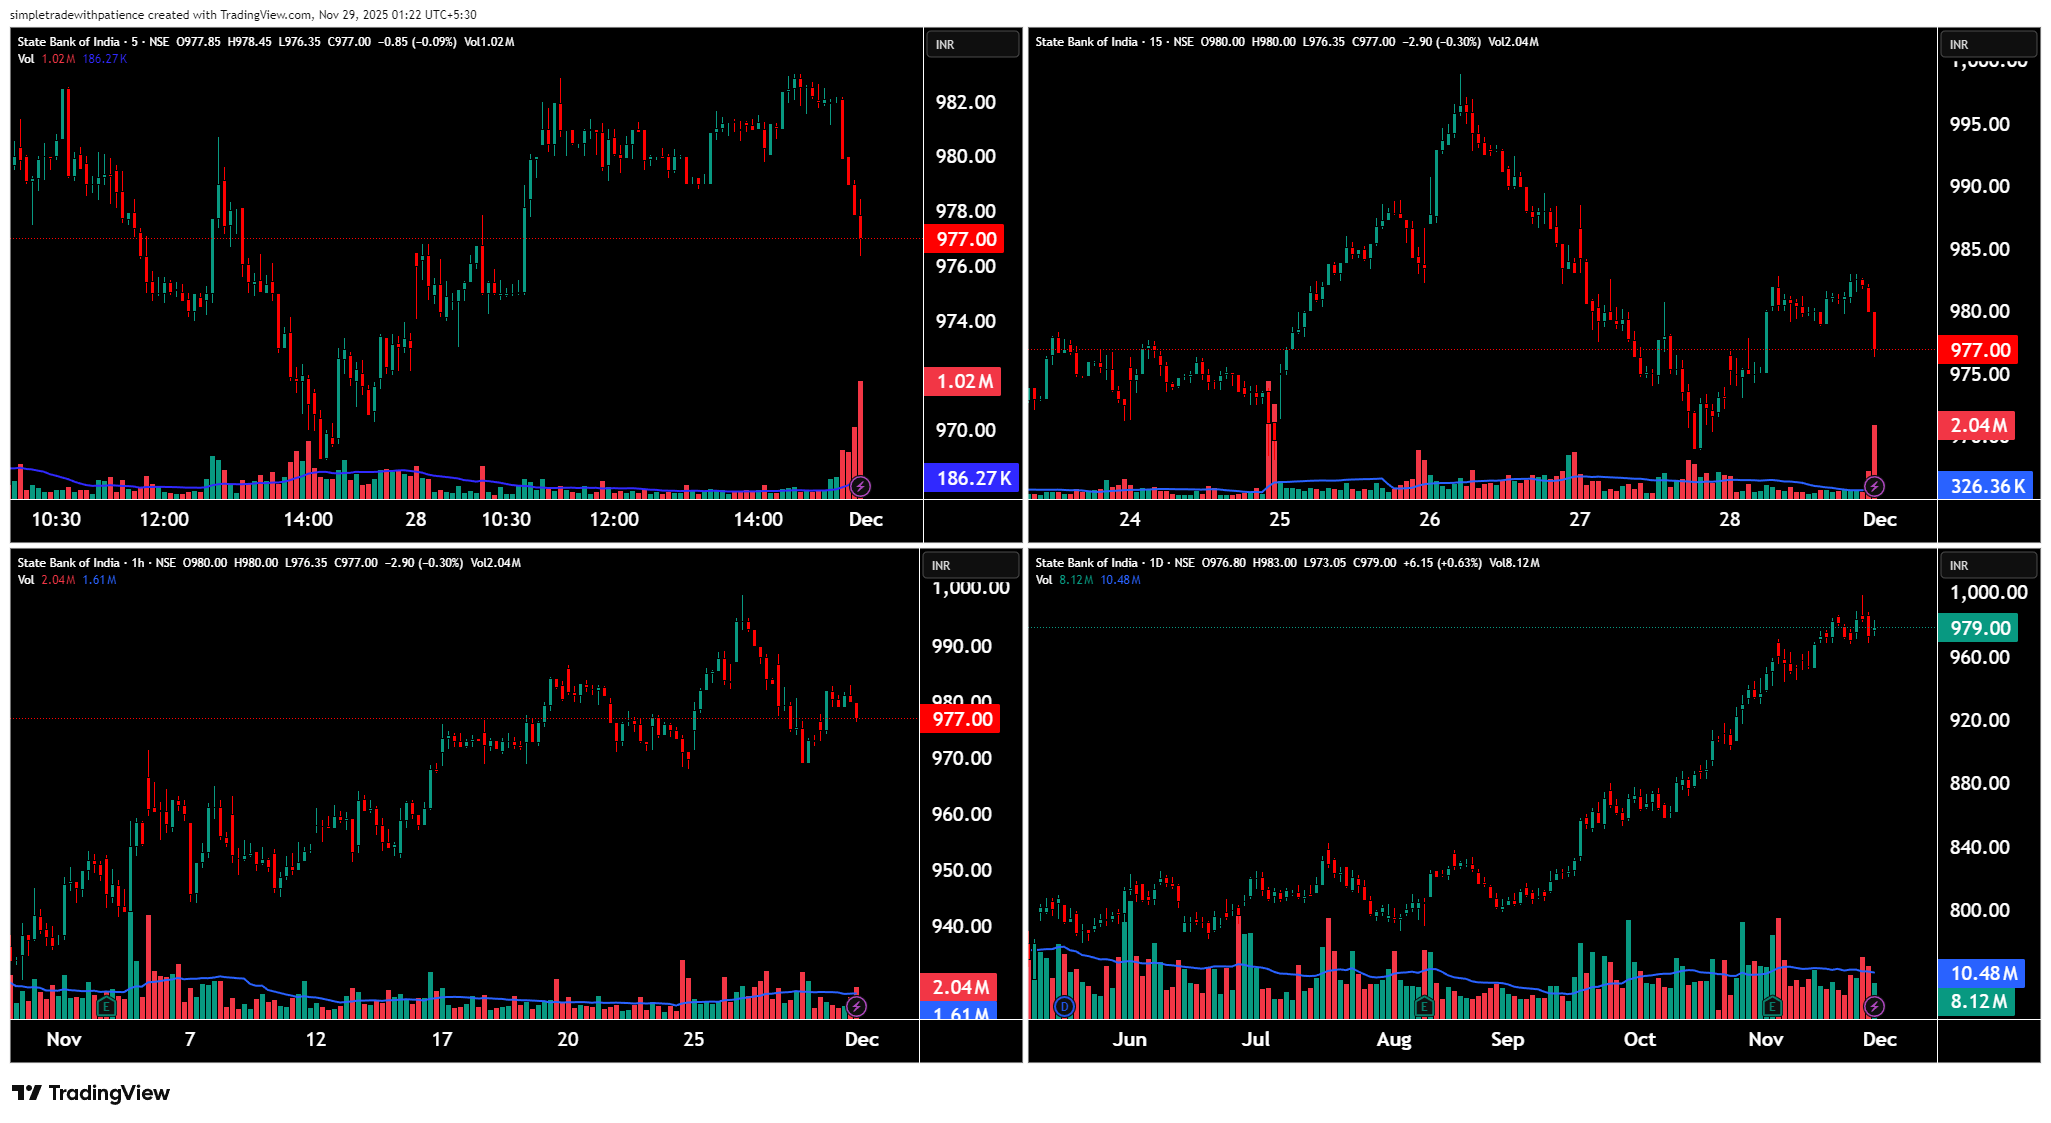
💹 State Bank of India (NSE: SBIN)
Sector: Banking & Financials | CMP: 977.00 | View: Steady Uptrend — Buyers Defending Momentum Zones
SBIN spent the session oscillating within a tight intraday range, but what stands out is the strong buying absorption visible at every minor dip. The stock opened around 978, attempted a shallow pullback, but quickly attracted demand near 975–977, helping it stabilise into the close. The volume spikes seen on the recovery candles indicate that institutions were active on the demand side, not letting the price slip below intraday supports.
Short-term structure remains constructive. On the 15-min and 1-hour charts, SBIN is forming higher-lows while consolidating just beneath the 982–988 intraday supply patch. This is a typical trend digestion pattern — momentum cools, price compresses, and buyers reload positions before triggering the next leg. The broader trend remains strongly bullish after the breakout above 950–960 earlier this month.
On the higher timeframe, the stock is moving cleanly inside an upward rising channel. The recent run-up from 930 to 1000 carried strong volume participation, confirming institutional accumulation. Price is now hovering near the upper band of its short-term range, with immediate supply at 985–995 and deeper supply above 1005–1015. Downside support zones rest comfortably at 965–970, followed by a stronger cluster around 950–955.
Option data builds the bullish case further.
• Strong long build-up in CE strikes from 975, 980, 985, 990, 1000 — buyers actively accumulating calls at multiple layers of strikes.
• Short covering visible in 950, 960, 970, 975 calls, showing shorts exiting as strength reappears.
• Puts mostly showed short build-up or long unwinding, telling you that downside protection demand is cooling off and traders prefer continuation on the upside.
• IV stayed stable around 15–16, favouring both momentum trades and intraday breakouts due to cheaper premiums.
In simple terms:
• Sustaining above 977–980 can ignite a clean push toward 990–1000.
• Break above 1000 opens the window to 1010–1020 quickly.
• If SBIN slips below 970, expect a small dip toward 960–965 where demand should re-enter.
For the next session, watch 980 closely. This is your trigger zone. If SBIN holds above it on strong candles, the long continuation trade becomes attractive, especially using 985 CE, 990 CE, or 1000 CE for directional play. Intraday traders should wait for a breakout candle on the 5- or 15-min timeframe with rising volumes. Avoid trading inside the noisy band of 973–979 where premiums decay sharply.
As long as the stock respects the 970 level and continues building higher bases, the short-term trend remains firmly positive. Only a sustained close below 965 will indicate a deeper pullback.
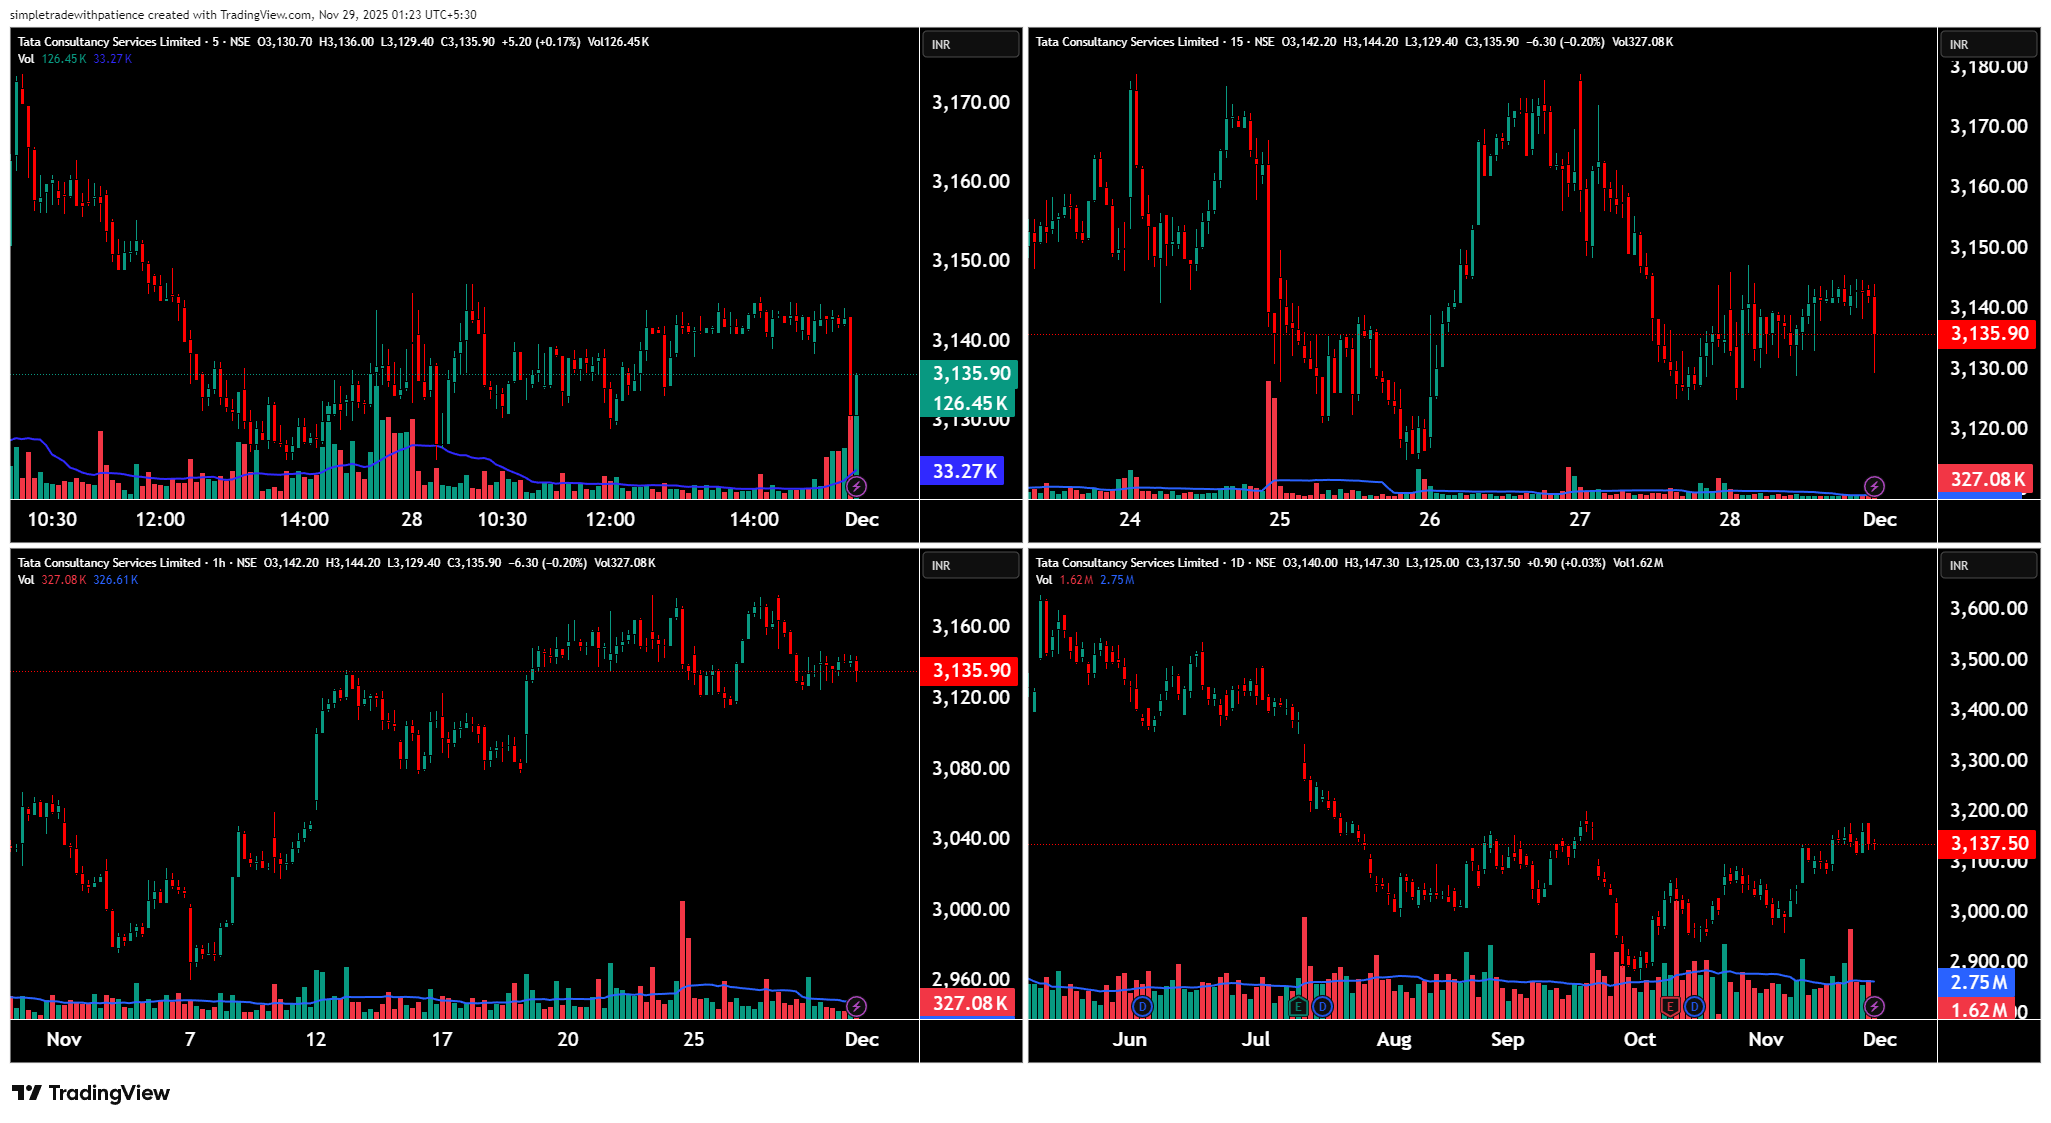
💹 Tata Consultancy Services Ltd (NSE: TCS)
Sector: IT Services | CMP: 3135.90 | View: Weak Momentum with Bearish Weightage
TCS traded with soft undertones throughout the session, and the price action was quite straightforward. The stock opened near the previous close but quickly showed signs of exhaustion as it failed to hold above 3160. Every minor uptick was met with supply, especially around 3155–3170, where sellers consistently stepped in. As the day progressed, the price slowly drifted lower and settled near 3135, signalling that sellers remained in control. Volume patterns also confirmed this — selling candles carried stronger participation compared to buying attempts, showing that the intraday weakness was genuine and not just random noise.
On the broader timeframes, TCS is still inside a slow upward crawl after a deeper correction, but it hasn’t managed to create a clean breakout structure yet. The stock has struggled to sustain moves above 3180–3200, with multiple rejections visible on both hourly and daily charts. Meanwhile, buyers have been providing support near 3080–3100, which has been holding well for the past couple of weeks. This tells us that TCS is still oscillating within a controlled range, without a decisive trend. For a beginner, the simple takeaway is: sellers dominate near 3180–3200, buyers defend around 3080–3100, and until one side takes control decisively, the stock will keep moving in this range.
Today’s option activity further supports this view. The strongest action came from traders building positions in the 3200 PE, showing growing interest in downside protection or directional bearish bets. This contract saw long build-up, meaning participants were expecting weakness as long as TCS remained below the 3160–3180 supply zone. On the call side, several out-of-the-money call strikes (3300 CE, 3400 CE) witnessed short build-up — which is typically a sign that traders do not expect the stock to rally strongly in the near term. Sellers are comfortable writing calls when they believe the upside is limited. Meanwhile, put traders were mixed — some were buying near-the-money puts, expecting a continuation of weakness, while deeper strikes like 3000 PE saw short build-up, suggesting confidence that the downside may not extend too aggressively. Volatility remained moderate, which means the market is not pricing in any dramatic moves for now. Overall, the options flow paints a picture of cautious bearishness, with traders leaning slightly toward weakness but expecting the downside to be gradual rather than sharp.
In simple words:
• If TCS stays below 3160, call options may remain weak.
• If TCS slips below 3120 decisively, put buyers may gain.
This is typical range-market activity where sellers dominate the higher levels while buyers step in only at strong support areas.
For the next session, the most important chart level is 3120. If TCS holds above this area, it may attempt a mild bounce back toward 3160–3180. However, if it breaks below 3120 and struggles to reclaim it, the next support lies around 3080–3090. For a bounce setup, the cleaner option is the 3160 CE, but take it only if TCS sustains above 3145 and starts building strength on 5-minute or 15-minute charts. Exit with a disciplined 20–25% premium-based stop-loss or if the spot falls back below 3130.
For a bearish breakdown setup, the safer structure is the 3200 PE, but enter only if TCS breaks below 3120, retests it from below, and trades under 3115 with fresh selling volumes. Exit if the option premium falls approximately 25–30% or if the spot reclaims 3130.
Avoid trading inside the tight 3120–3145 zone — price tends to get choppy, and premium decay accelerates. Keep your size under control and let the option premium guide your stop-losses instead of relying solely on spot levels. Watch open interest and volume behaviour closely; sudden spikes often reveal directional intent earlier than the chart. Overall, 3120–3160 is the battle zone for TCS. Holding above it can bring a bounce; slipping below it opens the room for more weakness. Expect the opening hour of the next session to be tricky — let the levels confirm and follow the structure with patience.
⚠️ STWP Legal Disclaimer (SEBI-Compliant)
This document is strictly for educational and informational purposes. All examples, charts, levels, and option structures discussed are illustrative and are not intended as buy, sell, or hold recommendations. STWP does not provide investment advice, trading tips, signals, or personalized financial guidance of any kind, nor is it a SEBI-registered intermediary or research analyst.
The analyses, illustrations, and risk–reward structures included here are generic in nature and based on publicly available data and observed market behaviour, which may change without notice. Financial markets involve significant risk; derivatives in particular carry the potential for substantial losses. Option premiums, implied volatility, open interest, delta, and other market variables can fluctuate rapidly and unpredictably.
Readers are solely responsible for their trading decisions, capital management, and risk assessment. Before making any investment or trading decision, please consult a SEBI-registered investment advisor. STWP, its representatives, and affiliates shall not be liable for any direct or indirect loss arising from the use of this material. Historical patterns or past market behaviour do not guarantee future outcomes. Nothing in this document should be interpreted as a promise of performance, accuracy, or returns.
Position Status: No active position in any of the above-mentioned stocks at the time of analysis.
Data Source: TradingView & NSE India (Past Chart Reference for any charts used).
💬 Found this useful?
🔼 Boost this post to support structured learning
✍️ Share your thoughts or questions in the comments
🔁 Forward this to traders who value clean technical studies
👉 Follow for disciplined, structured, STWP-style analysis
🚀 Stay Calm. Stay Clean. Trade With Patience.
Trade Smart | Learn Zones | Be Self-Reliant 📊
{{DATE}}


 Launch your Graphy